Running Visual Studio Remote Debugger in Domain Environment
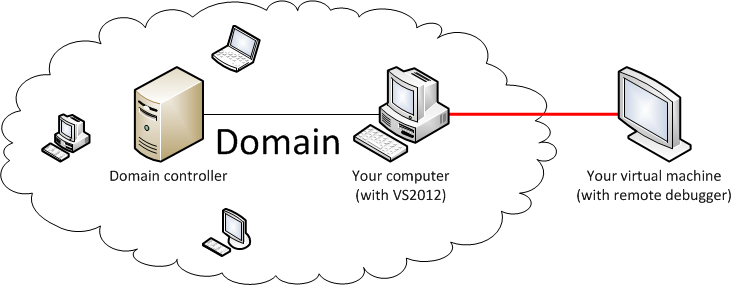
This article describes scenarios in which you need to connect to Visual Studio Remote Debugging Monitor, hereinafter remote debugger, running on a computer that is not part of a domain from a computer that is in a domain.
During development of the new
Installer we came across several difficulties regarding remote debugging. We needed to debug the installer in various environments, on various operating systems with different settings. We've prepared lots of virtual machines to cover most scenarios and installed remote debugger to each of them. I'm now presenting obstacles we encountered and complete solutions to avoid them.
Setting Up the Remote Environment
To prevent "Error: The Microsoft Visual Studio Remote Debugging Monitor on the remote computer is running as a different user":
-
Create an account with the same username and the same password as your domain account.
-
Assign that account to the Administrators group.
-
Log in under this account.
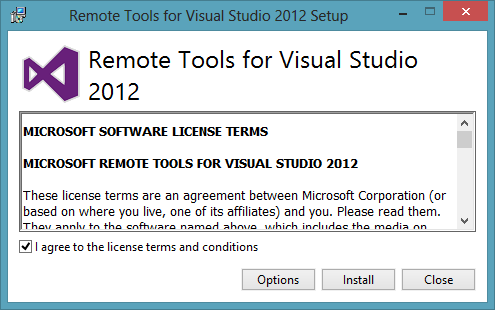
Installing Remote Tools for Visual Studio 2012
Mount your ISO image of Visual Studio and navigate to .\Remote Tools\ folder. There you can find setup files for x86, x64 and ARM platforms.
Running Remote Debugger
You have two options for running the debugger:
-
As a service
-
As a standard process
I recommend setting up both so that if one starts saying "Invalid access to memory location." you can use the other. Remember to set up the service first as it's easier to configure the environment (you don't have to change port of the service).
By default remote debugger tries to listen on 4016 port.
Running as a service
-
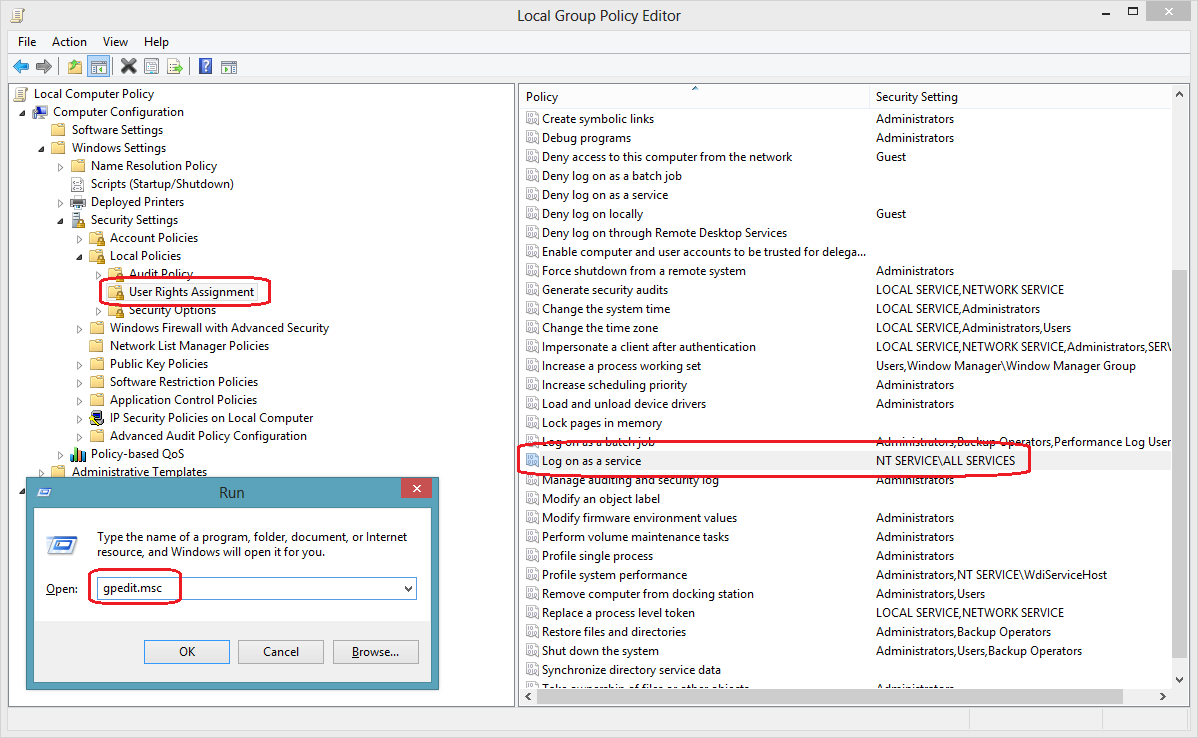
Press [Win]+[R] (Or Start->Run) and type gpedit.msc
-
Navigate to Computer Configuration->Windows Settings->Security Settings->Local Policies->User Rights Assignment
-
Set up "Log on as a service" as shown on picture below
Now you have to configure remote debugger:
-
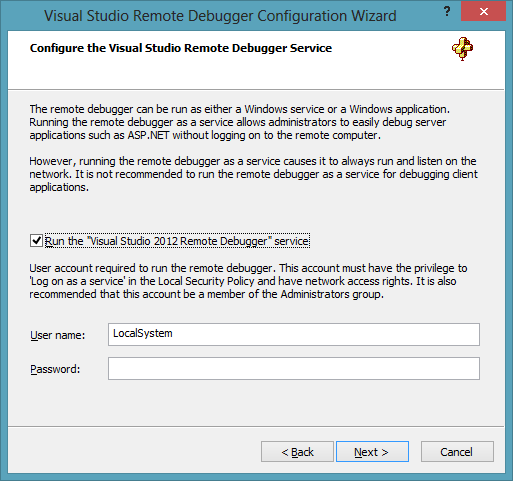
Launch Remote Debugger Configuration Wizard and click next.
-
Check Run the "Visual Studio 2012 Remote Debugger" service checkbox and click Next
-
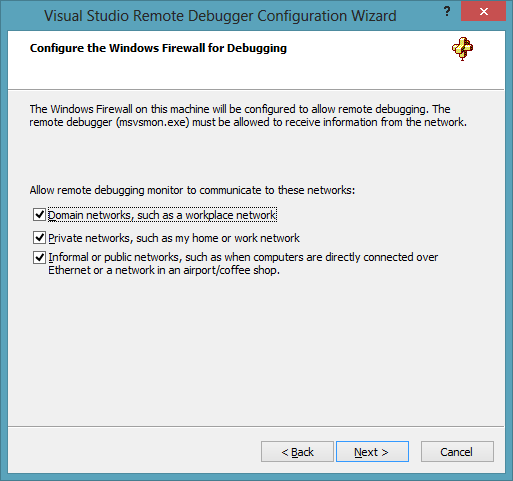
On the next screen enable all three checkboxes and finish the wizard.
Running as a standard process
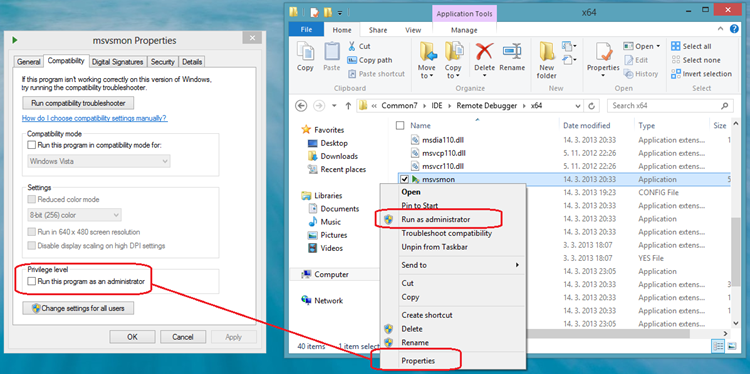
Remember to run the debugging monitor as an administrator. You can do [Shift]+[Right click] click on its icon and "Run as administrator".
Or, if you want to set this permanently go to properties of Debugging monitor and check "Run this program as an administrator" checkbox on Compatibility tab.
You can do this both on the original "msvsmon.exe" or any of its shortcuts.
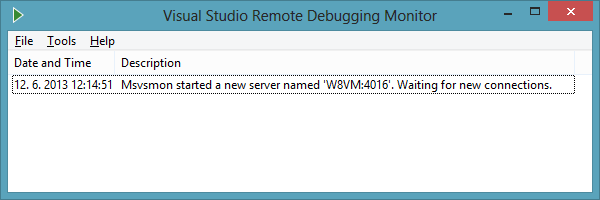
When you launch remote debugger you should end up with the following screen:
There are few options under the tools menu regarding permission, authentication etc. You can leave everything in the default state.
Configuring firewall
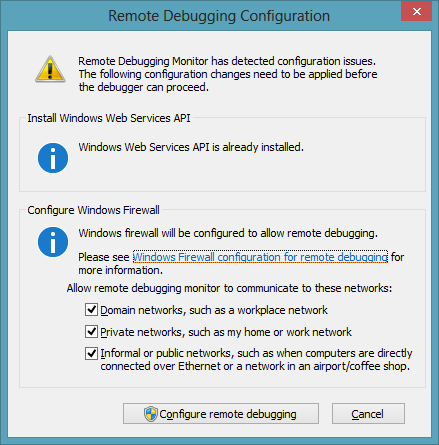
On first launch, the remote debugger will ask you to add firewall rules. Make sure you allow all the rules:
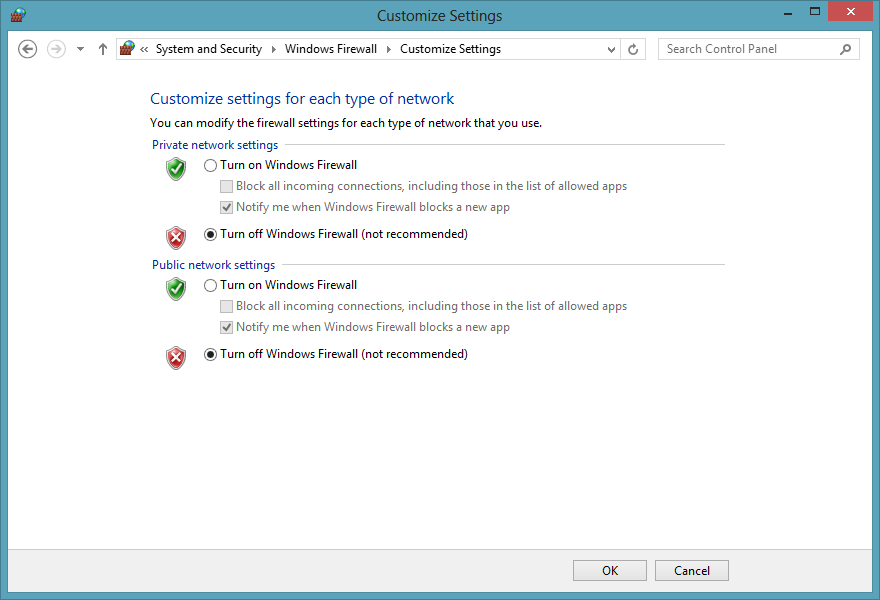
If you're still receiving the error "
The Microsoft Visual Studio Remote Debugging Monitor (MSVSMON.EXE) does not appear to be running on the remote computer.", you can try to disable firewall completely. You can do this by navigating to firewall settings and clicking "Turn Windows Firewall on or off".
There is also one more approach to resolve the error above from
Microsoft.
Connecting to Remote Debugger
I assume the service or process or both are running; the process you want to debug is also running on the remote machine so now we are ready to start debugging.
-
Start Visual Studio 2012 on the local machine.
-
Open solution of the process you want to debug.
-
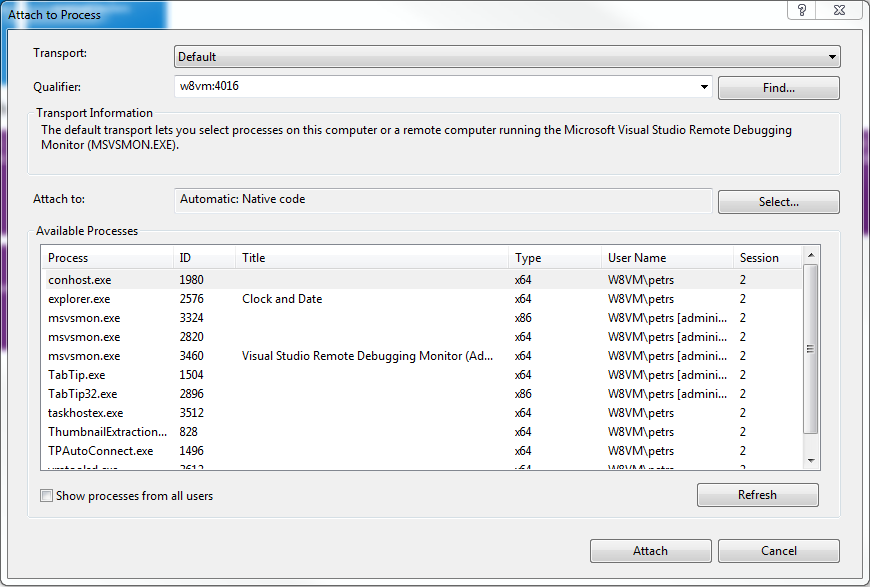
Click Debug->Attach to process
-
Type qualifier, in my case "w8vm:4016" (the qualifier is shown in console of remote debugger, it's in format machinename:port)
-
Click refresh
-
Select remote process from list offered
-
Attach to that process
Now you can use debugger as you are used to. You can place your breakpoints, evaluate variables in watch, etc.
Resolving errors
When you receive "Unable to connect to the Microsoft Visual Studio Remote Debugging Monitor named 'w8vm:4016'. Invalid access to memory location.", do not panic. Try to restart visual studio (you have to close all running instances). If this doesn't help, try to connect to the debugger service instead of the debugger process or vice versa.
Debugging tips
-
Use Debugger.Launch() and Debugger.Break() to initiate debugging and perform a break. It's the same as a breakpoint in your code. You'll find it useful e.g. when your application cannot be launched by debugger directly from Visual Studio.
-
Enrich your application with DebuggerDisplay attributes which will allow you to propagate important properties in debugger watch. So e.g. instead of an array of meaningless objects, you will see each item under its real name.
-
Remote debugger also supports command line mode; just launch "msvsmon.exe /?" for more information.
Conclusion
I see the remote debugger as an extremely powerful tool though it's not always easy to configure it. I hope this article made some things clear. Please feel free to leave comments below. If you have any additional tips it would be nice to share them with others. I'll then gladly update this post.