Kentico MVC and Google Analytics: Custom reports, part 1
Do you have Google Analytics employed in your Kentico MVC website? Do you miss the Search engines report that was available in Kentico Web Analytics? This article comes to the rescue. Here's how you quickly create such report in Google Analytics (GA).
Why custom reports
First, let's do a small step back and ask ourselves why.
Theoretically, there might be two possible approaches to replacing the missing Kentico Web Analytics (WA) reports in Kentico MVC websites:
- Use GA as a dedicated reporting tool
- Implement a mechanism that submits data from an MVC website to the WA reports in Kentico through API
While the second approach might seem advantageous for those who are already familiar with WA, the first approach offers many other benefits. For example, non-technical users will be able to:
- Combine various data dimensions and metrics by non-technical users
- Drilldown from aggregated views to detailed ones
- Create custom reports from the ground up by non-technical users
- Use the Save as feature to capture (and restore) any configuration of a certain report into a named custom one
This article shows how to recreate the Search engines report that has been located in WA under the Traffic sources category. The next article will explain how to create the Invalid URLs report that mimics the Invalid pages WA report found in the Content category.
Creating the Search engines report
The original Search engines report in WA shows traffic from all search engines, together with statistics for each of the engines registered in the Search Engines application in the Kentico administration. Namely, the report shows the number of views initiated by each of the search engines, along with a percentage in the whole traffic volume. You can also adjust the time scope of the report, like in any other WA report.
You'll create a similar custom report in GA that will also tell, which landing pages are the most visited from all organic searches. If Google and others hadn't stopped telling us about the search keywords in the past, the new report would have been able to also display the most common search keywords for each of the landing pages. In fact, your report will be able to provide those keywords, however, just for a small fraction of the whole search volume. Better than nothing.
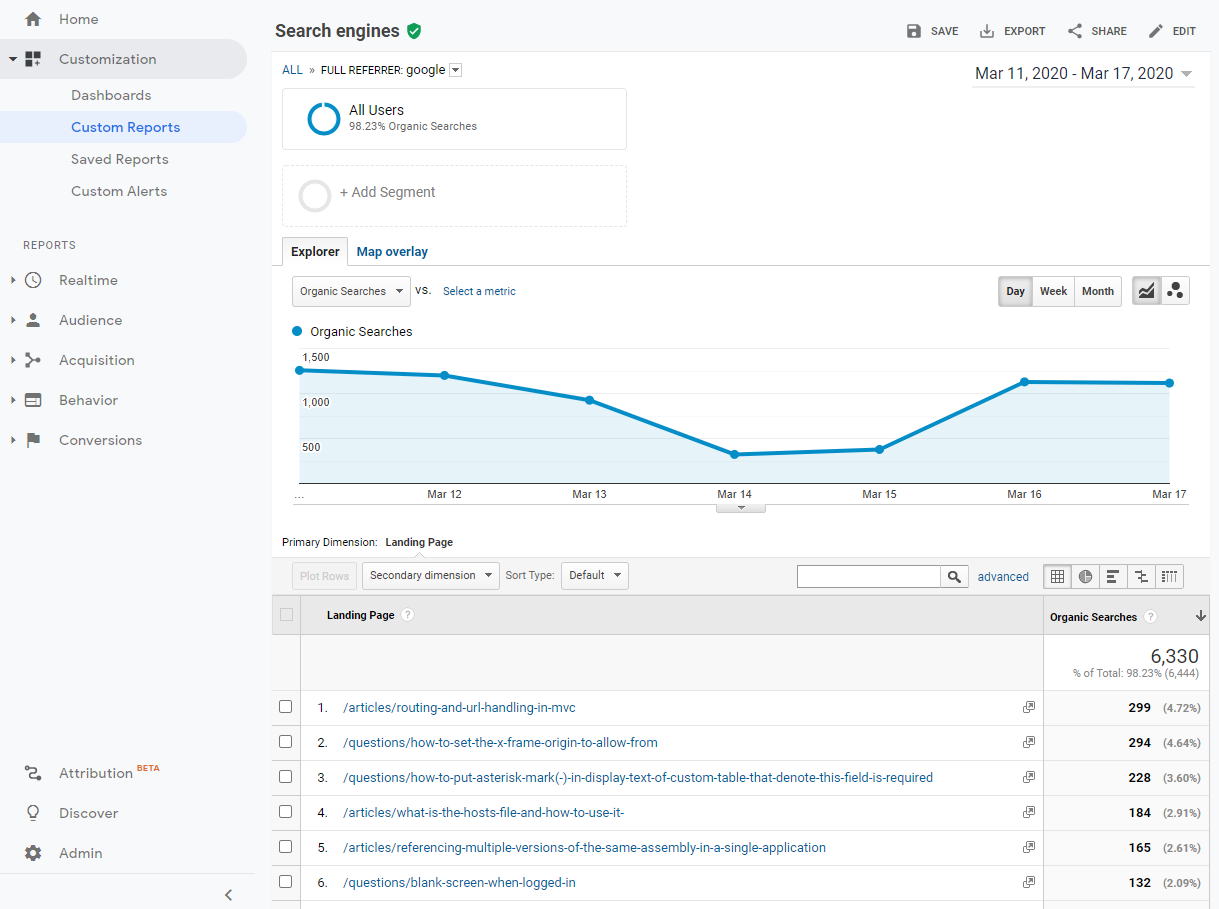
When opened, the report tells which are the biggest sources of organic searches.
It allows you to drill down to the detailed information about which are the most visited landing pages.
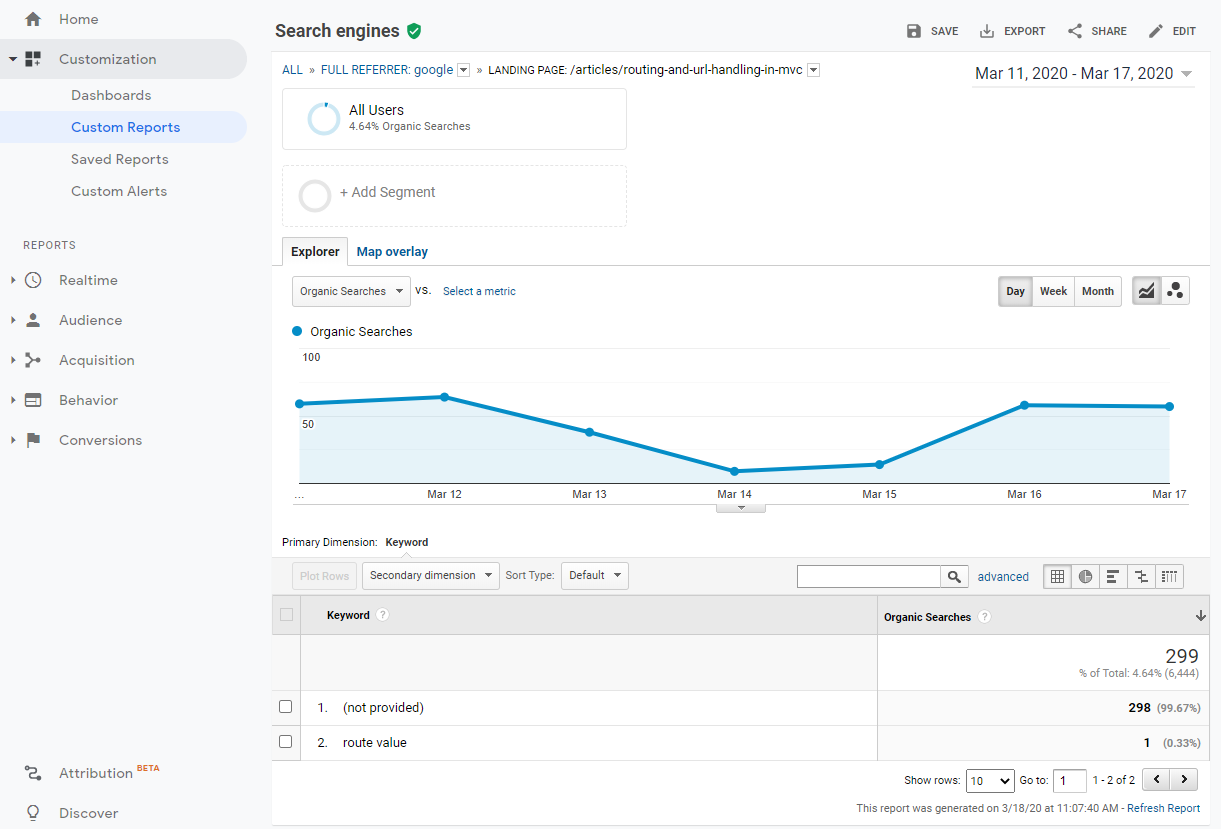
You'll be able to click through again to see those few search keywords that the search engine disclosed. However, remember that most of the keywords will sadly be hidden under the (not provided) label.
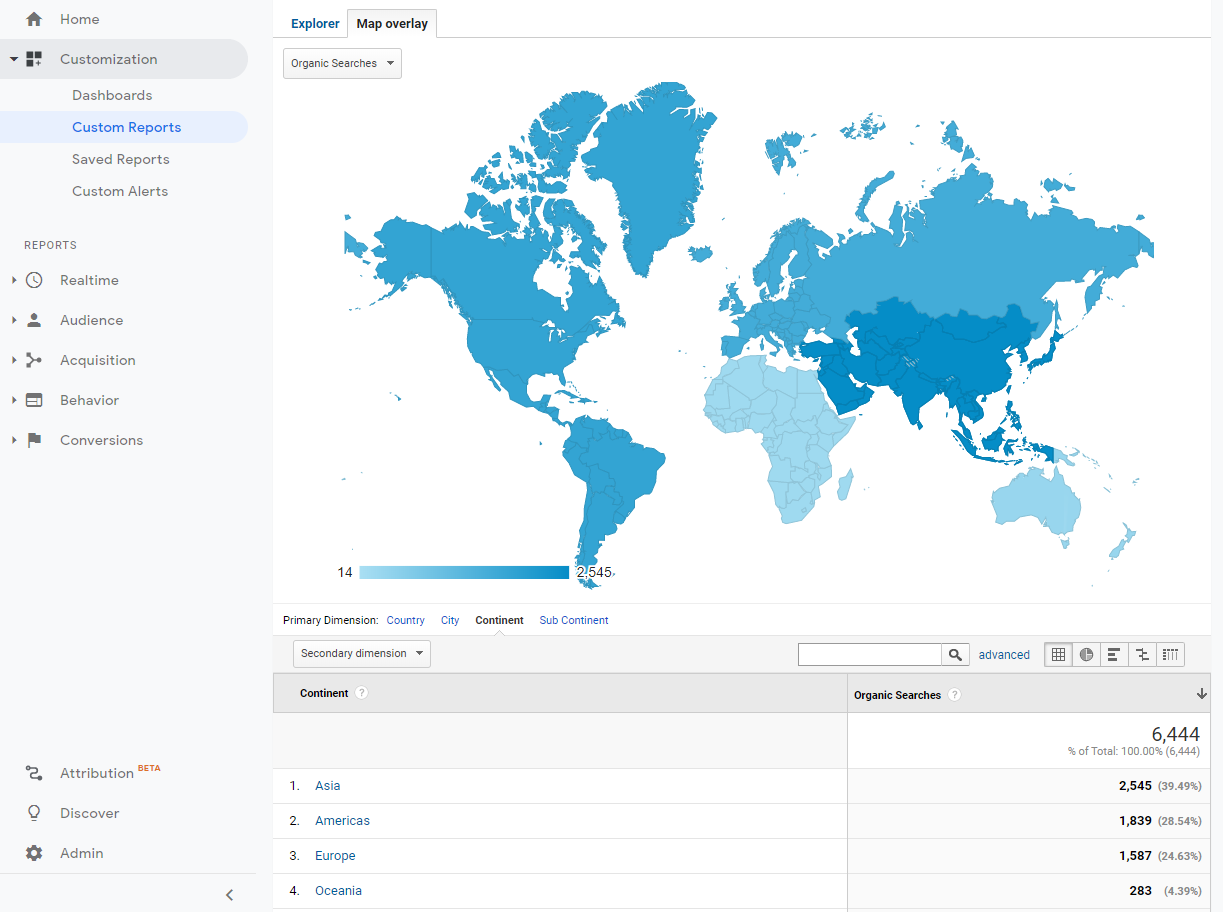
You'll also be able to view a map overlay showing you the density of searches across continents, subcontinents, countries, and cities.
Implementation
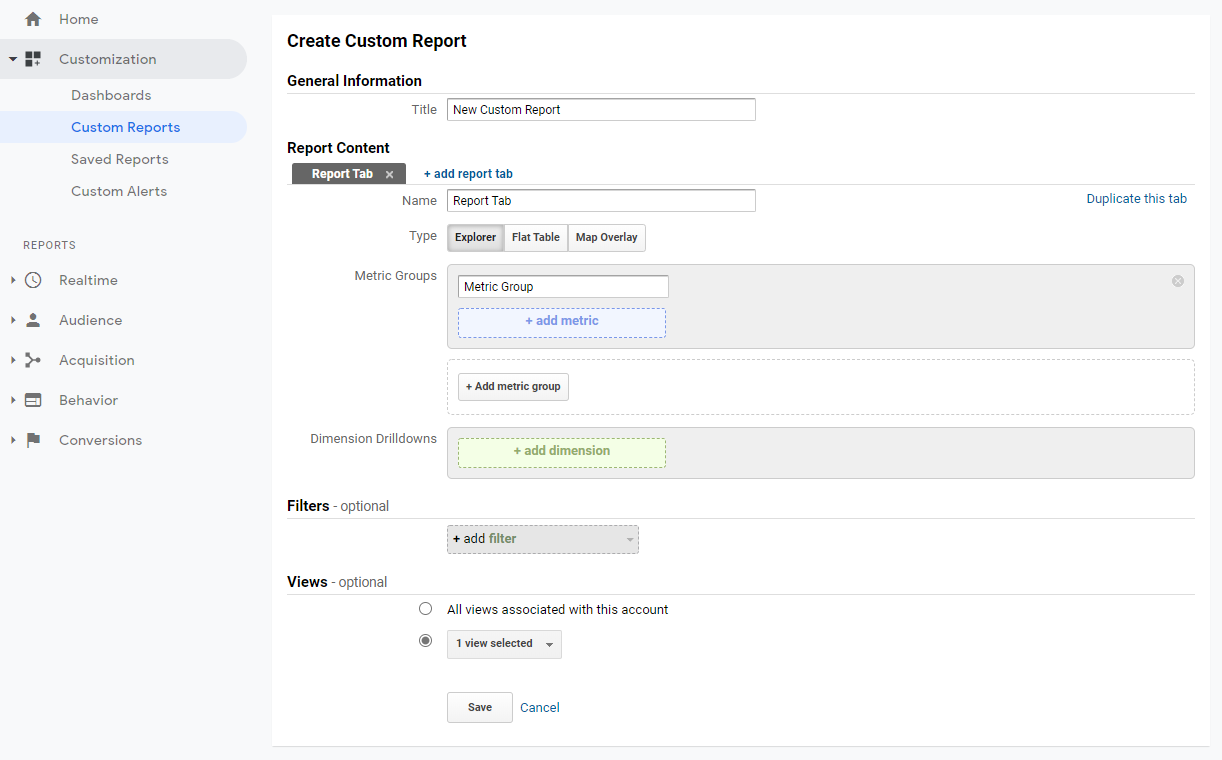
In the main menu of GA, click Customization > Custom Reports > New Custom Report.
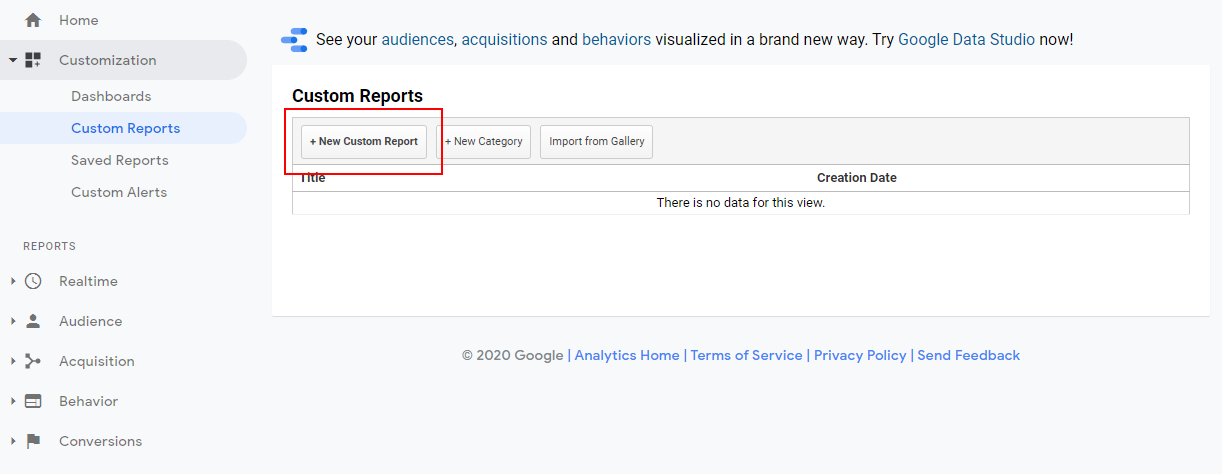
You'll see a configuration form that has three main parts: Report Content, Filters, and Views.
- In the Report Content section, you'll be able to define tabs, metrics, and dimensions.
- In the Filters section, you'll have a chance to restrict the report, if you haven't done so at the view level earlier.
- The Views section will let you assign the custom report to certain views (or to all of them).
For demo purposes, just skip the last two sections, focusing solely on the Report Content one.
First, name the current tab, e.g., Explorer. Then, pick metrics and dimensions. That's the crucial part. What is the difference between metrics and dimensions? Well, anything that can be quantified or otherwise counted is a metric. Dimensions are textual or numeric values that you want to see in detail. Thus, in this report, pick Organic Searches as your metric, followed by three dimensions in the drill-down ladder:
- Full Referrer
- Landing Page
- Keyword
The Keyword dimension was left as the third one on purpose. Because search engines don't provide most of the search keywords, the respective dimension is doomed to be the least important one. Otherwise, feel free to decide, which dimension you deem as primary and secondary in the drill-down ladder. If you select Landing Page as the primary one, you'll be able to tell what are the most searched pages on your website, irrespective to which of the search engines the visitors came from. In our demo, we settled with the following configuration.
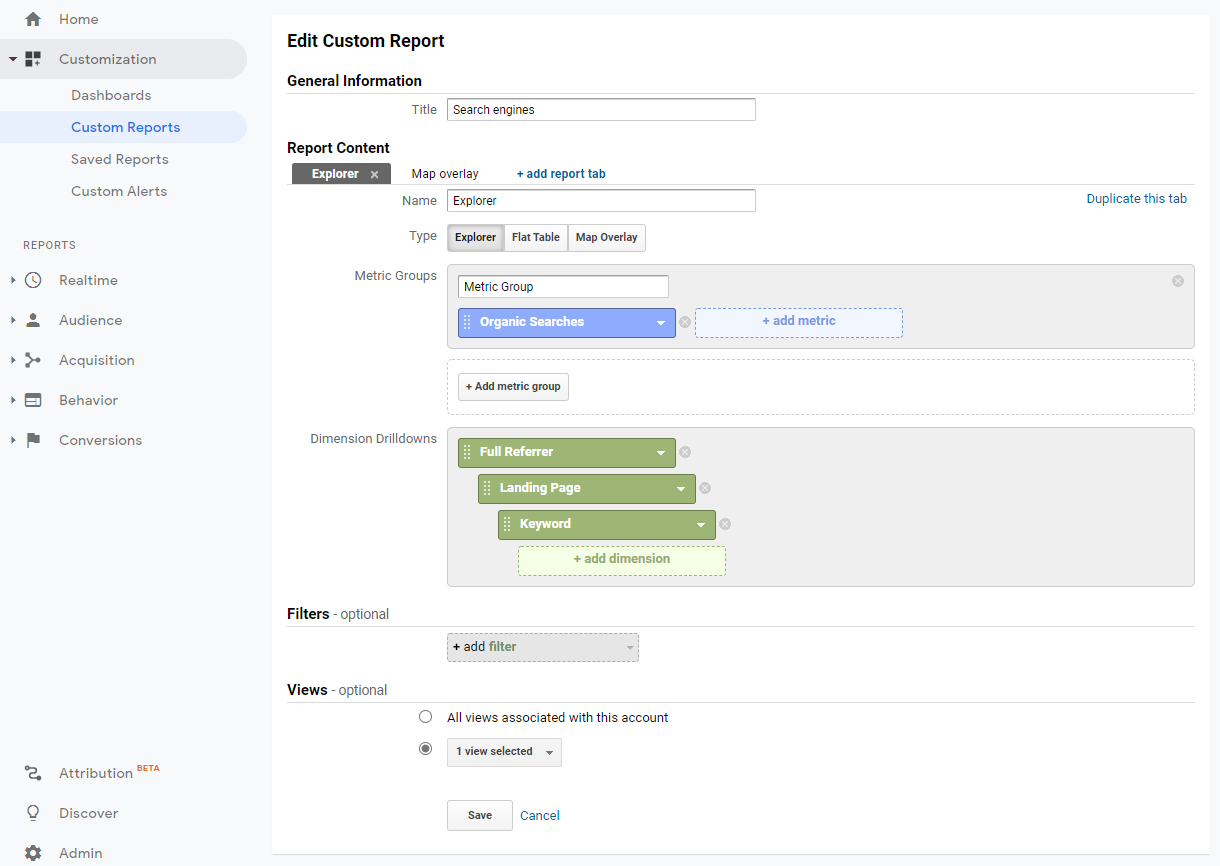
When you're done with the Explorer tab, click + add report tab to add the second report and call it Map overlay.
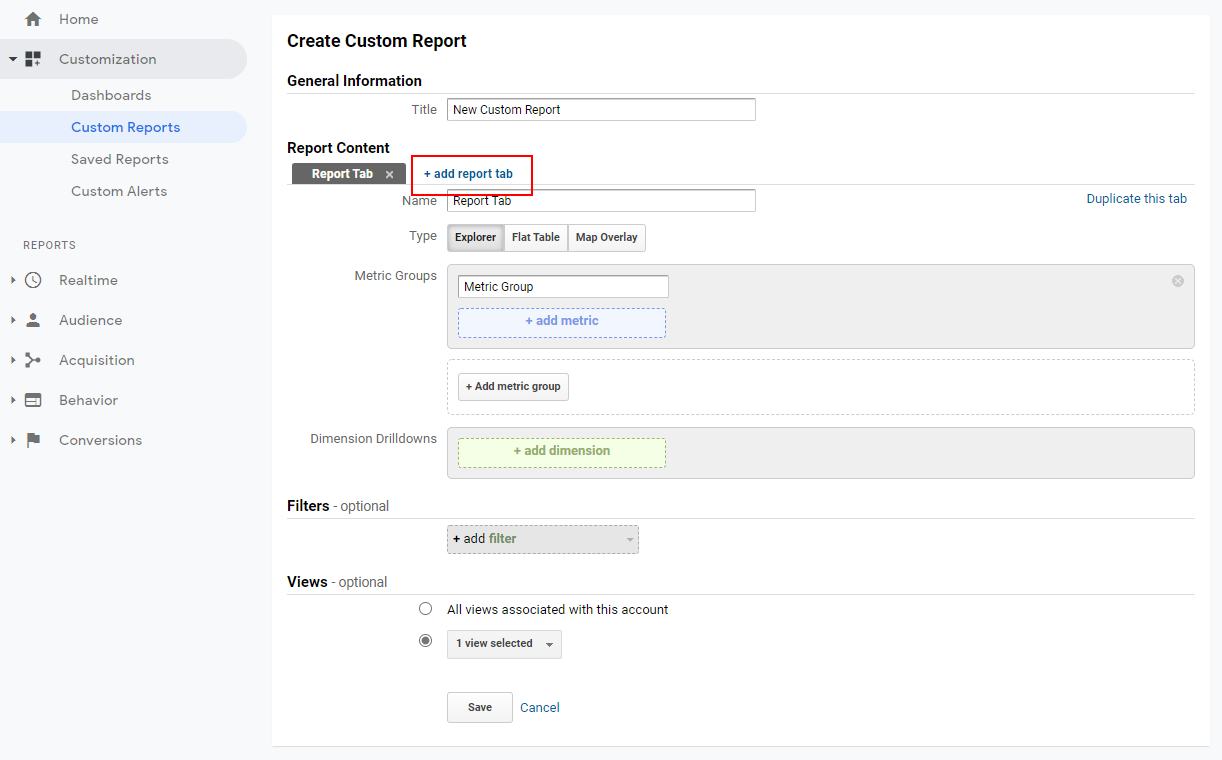
Select the Map Overlay button in the Type field and the Organic Searches as the metric.
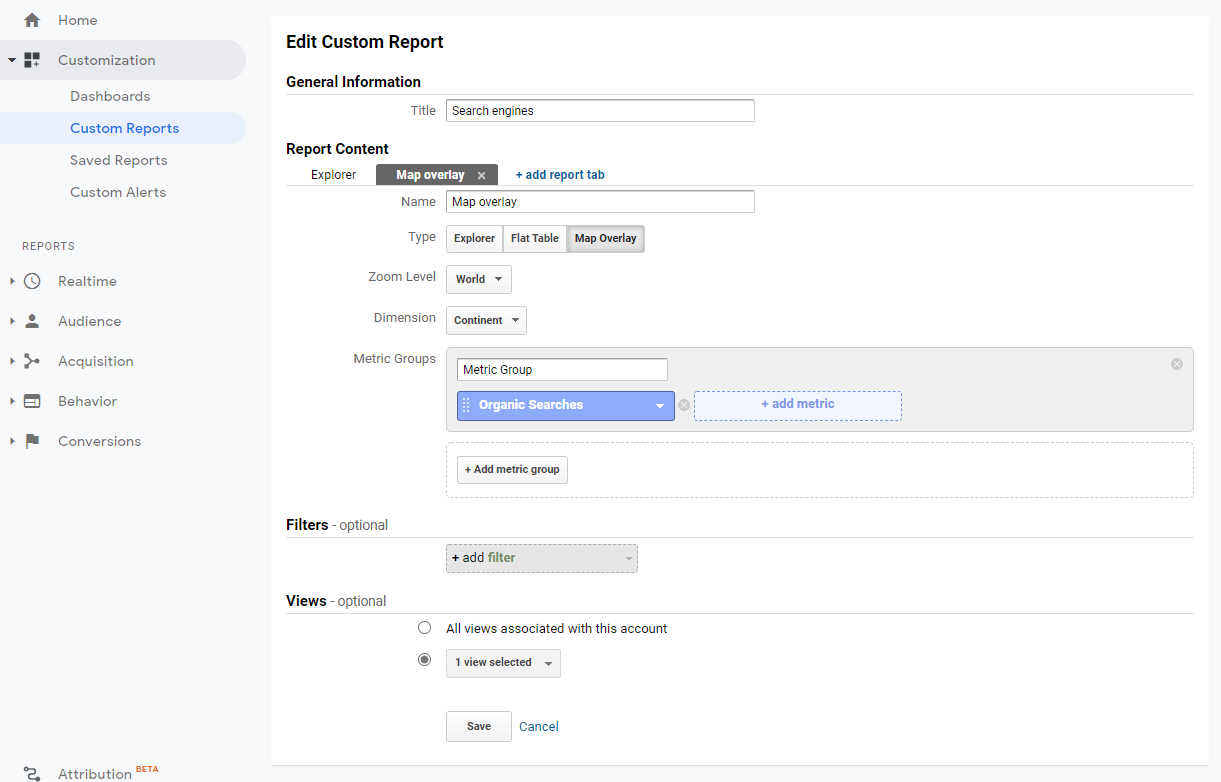
This type of tab does not support displaying of dimensions, sadly. However, you can work around that by just adding the Continent or Sub Continent dimensions into the Explorer tab (or create another dedicated tab).
Voila! You can now save and view your report. In the Explorer tab, you can either dig down the dimension ladder, or you can add whatever dimension into the table as a secondary one. What's even better, you can now open the landing pages directly from within the table.
Get the report
To free you from creating the report time and again, we've uploaded the definition of the report to the Google Solution Gallery. Feel free to download it into your GA account.
Conclusion
You're now done. You can now see not only how many times your site appeared in search results. You also can find out what the most-visited landing pages are, either per-search-engine or regardless thereof.
In the next part of this series, we'll teach you how to employ advanced GA techniques to create an alternative to the Invalid pages WA report.