Using the Kentico Power BI Reports
Every feature added to Kentico is designed to improve users’ experiences with the platform. Whether they are developers or marketers, everyone’s time is valuable and ensuring a productive experience is key. As more and more roles are driven by data, providing employees with fast and efficient tools to consume and understand the information is important. In this article, I’ll show you how we’ve added support in Kentico for Microsoft Power BI reports to help your users track email campaigns and activities.
From application usage tracking to machine learning, data is certainly changing the way companies do business and measure results. Not surprisingly, enterprise vendors like Microsoft are continuing to release and improve the tools clients use to view and understand this data. Microsoft Power BI is one of the most popular tools and is used in every industry and region. With Power BI, users can format and visualize data to better understand their information, all within a graphical interface.
To help marketers better understand the effectiveness of their email campaigns with Kentico, Power BI support has been added for versions 9 & 10. In this blog, I’ll show you how to leverage this new support and provide great reporting capabilities for your users.
1. Install Power BI Desktop
The first step of the process is to install the Power BI Desktop application. This program allows you to design and manage data queries and reports.
You can install the Power BI Desktop application here.
2. Install the Kentico Power BI Reports extension
After installing the Power BI Desktop application, you will need to install the Kentico Power BI Reports extension. This free add-on contains over 25 pre-built Power BI reports to help you view and analyze your Email Marketing data. After installing, you can edit the queries to customize the reporting to your needs.
You can download the Kentico Power BI extension here.
3. Open the Power BI .pbit file
After downloading the extension and unzipping, open the Power BI Desktop and open the downloaded .pbit file. Opening this file will prompt you for your Kentico installation database credentials.
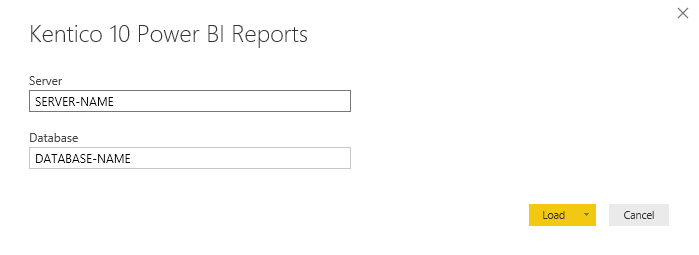
After entering your server and database, Power BI will attempt to authenticate your access to the database. Power BI will request access to execute the data queries. You will be prompted for approval for each query.
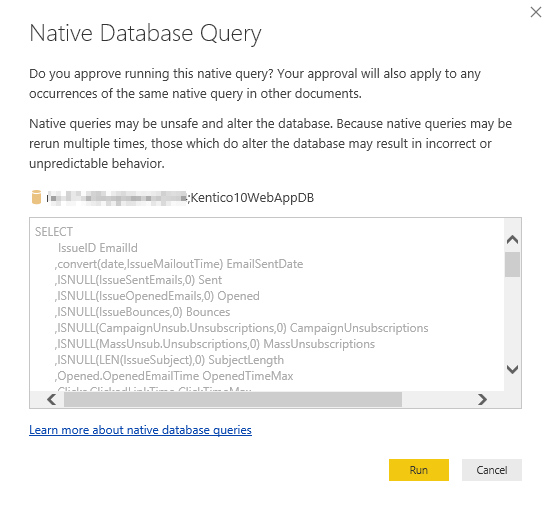
Once you have approved all queries, you will be prompted for the database credentials.
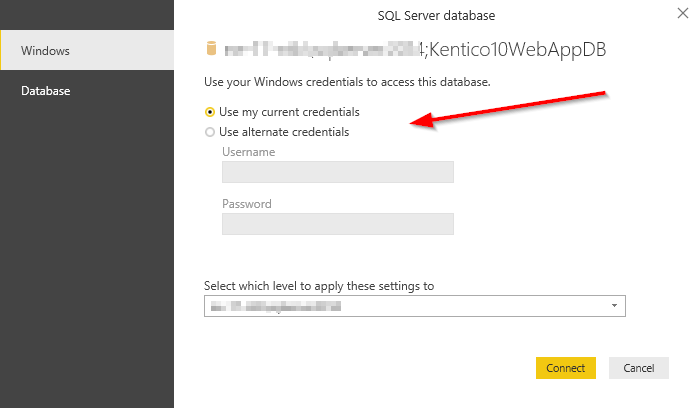
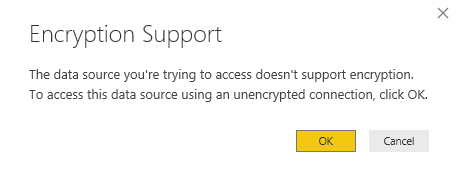
After entering the credentials, you may be prompted with a warning about the data source not being encrypted (depending on your environment). To continue, you must click OK to allow unencrypted connections.
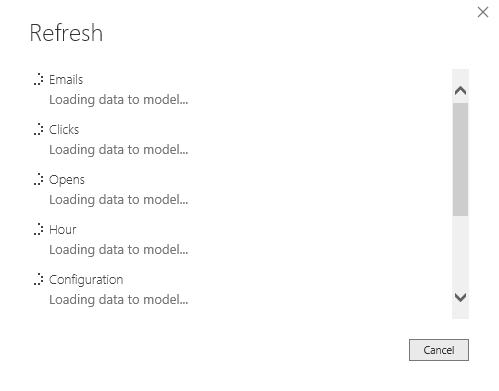
After allowing the connection, you will see the queries being refreshed.
4. Viewing the reports
With the extension installed and configured, you are ready to view your Email Campaign data. These reports will allow you to view all aspects of the campaign and evaluate its effectiveness and reach.
The Kentico Power BI extension contains the following reports:
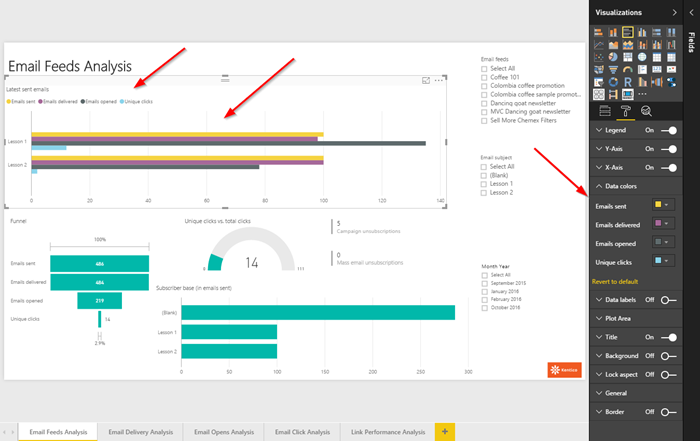
Email Feeds Analysis
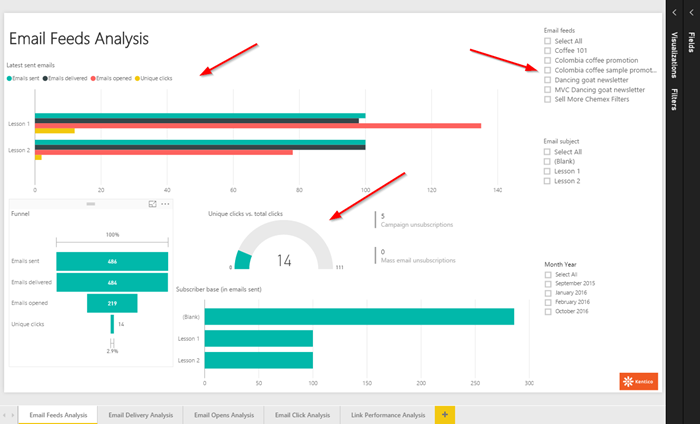
This report details the number of emails sent, delivered, opened, and clicked. It also allows you to filter the reports for a specific campaign, subject, and time frame.
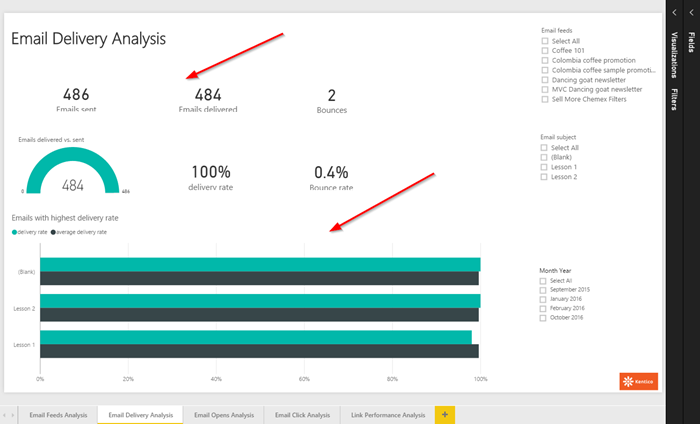
Email Delivery Analysis
This reports details the effectiveness of your email delivery. Most notably, it displays the number of bounced emails for the campaign(s) to help you understand the effectiveness of your communication.
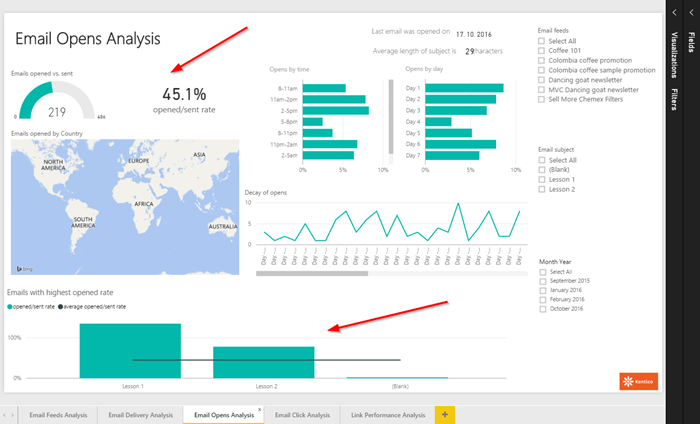
Email Open Analysis
This report shows you when and where your emails were opened. You can view statistical information on recipient location, time of open, and which emails received the highest open rates.
Email Click Analysis
This report displays information on how well your users interacted with the email content. This includes click rates, unique click rates, and the most interactive contacts.

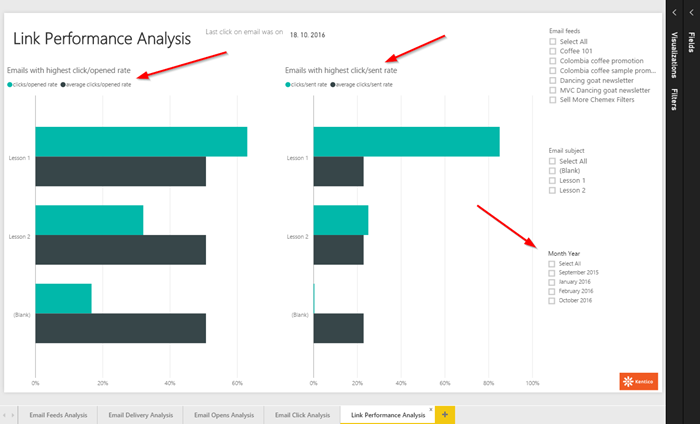
Link Performance Analysis
This report shows you which emails had the highest amounts of clicks.
Customizing the reports
While the pre-made Power BI reports may be very useful, you may need to customize the reports to suit your individual needs. This may be in the form of additional data capture and analysis, or modifying the formatting of the reports. You can easily modify the reports from within the Power BI Desktop interface.
Moving forward
With the Kentico Power BI extension, you can provide a great interface to view your Email Campaign data and understand how well your communication is received. Because they are built on top of the Power BI engine, we will continue to build on these reports and offer new data visualizations in the future for other aspects of the system. If your business needs require a report not already included, you can modify the data to suit your needs. Good luck!
You can read more about the Power BI Reports in the Kentico documentation here.