Quick Tip: Viewing Running Worker Threads in Kentico
Understanding what’s happening within your application is key to running a high-traffic site. Every MB of RAM matters, and understanding your resource utilization as much as possible will ensure your site is running as optimally as possible. Often, background processes and tasks can drain your site’s horsepower and slow down the application. In Kentico, you can easily view what tasks are running and which ones are sleeping by viewing your Running Worker threads.
Understanding which tasks are currently running can be key to diagnosing a performance issue on your site. If you have a particular process that is constantly running, it can impact the application’s ability to respond to requests and server content. Luckily, Kentico provides a helpful module for viewing any current tasks and their status.
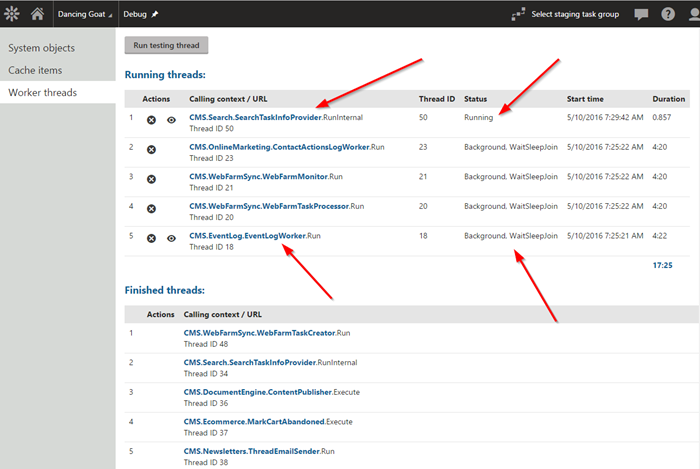
In the Debug module, select the Worker threads tab. This utility will show you any currently running tasks, completed tasks, and any tasks that are in a sleep state and awaiting their next execution.

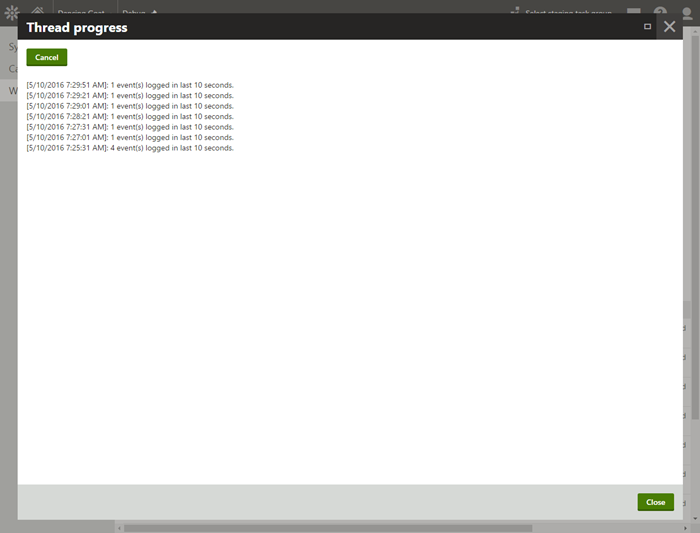
For any running thread, you can view a log of the thread activity by clicking the View icon.

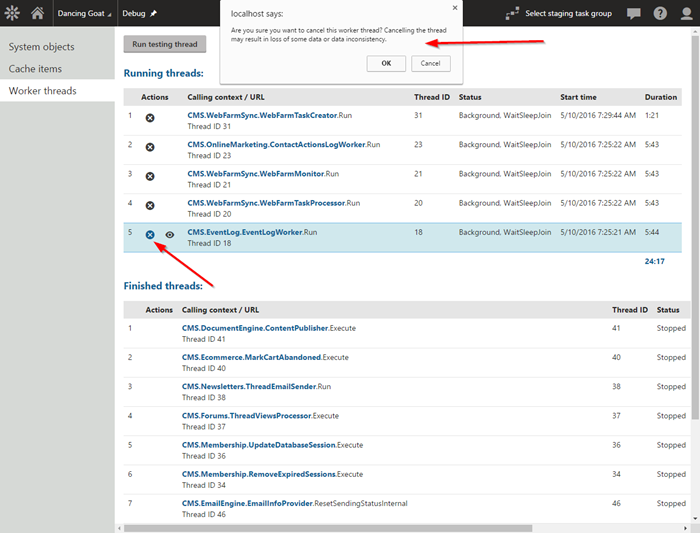
If you want to stop a task, click the Cancel icon next to the thread to end it.

With this utility, you can view any threads that are run within the application and identify any long-running processes. This information can be very useful when isolating any performance problems or when tuning your site. In the past, I have used this module to track the following:
- Smart search rebuild tasks
- Scheduled task processing
- Email sending
The Debug module is full of several other helpful tools and resources. Be sure to check out the available debug options and configurations—just be sure to disable them before going live with your site! Good luck!