Google Chrome Developer Tools - Overview
In
this previous post we looked at how to use the Google Chrome Developer Tools to change user agents. That just scratches the surface of the available tools within Google Chrome. In this post we’ll take a look at the broad set of tools available. Please keep an eye out for additional posts that we will look further at how these are used.
Accessing the tools
Accessing the developer tools within Google Chrome can be done several ways. Here are the three that I am most familiar with.
-
Open Chrome and bring up http://www.kentico.com site and then select CTRL + Shift + J to bring up the Chrome Developer Tools panel as shown in the following screenshot.

-
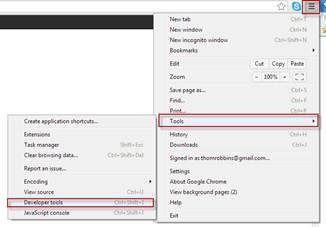
Select the Menu icon (three lines), select Tools and then click Developer tools to bring up the Chrome Developer Tools panel as shown in the following screenshot.

-
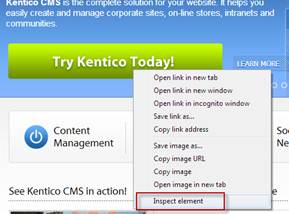
On a page right click an element and select Inspect Element as shown in the following screenshot.

Tools Overview
In the Google Chrome Developer tools there are eight main groups of tools available as shown in the following screenshot.

These provide the following features
|
Group Name |
Description |
|
Elements |
Used to view the DOM tree, CSS styles, HTML and manipulate these in real time. I often use this as a way to view page source. |
|
Resources |
Used to view what components a page or application is requesting from web servers. This includes session storage, cookies and application cache. |
|
Network |
Used to inspect resources that are downloaded over the network. This includes the HTTP method used, status, type, and latency. This also includes a really nice waterfall graph. |
|
Sources |
Great way to look at what’s happening with Javascript on a page. |
|
Timeline |
Provides an overview of where time is spent loading and using a web page. |
|
Profiles |
Used to profile the execution time and memory usage. |
|
Audits |
Used to provide suggestions and optimizations for decreasing perceived or actual load time. |
|
Console |
Awesome tool to interact dynamically with the page! |