Displaying Poll Results in Kentico
I’m pretty sure an hour after the first website launched in 1991, someone put a poll up asking people a profound question to get their opinions. Since then, polls have continued to be a great way to get a feel for how your users like a product, enjoyed an event, or any other type of survey. Kentico has a built-in poll module that allows you to place polls on your site easily and get feedback from your users. In this blog, I’ll show you how, with a little bit of JavaScript and API code, you can display poll results anywhere.
Recently, we have started putting a poll up every Friday on DevNet. The topics range from programming to community-based ones and give us great insight into our users. While these results are easily viewable from within the Poll Module (or after voting), I wanted to see what it would take to display the data a little more graphically. Specifically, I thought it might be nice to display a pie chart of the votes for each poll.
1. Creating a new web part
The first step of the process was to create a new Poll Chart web part. Nothing special here, just a basic web part with a blank layout.
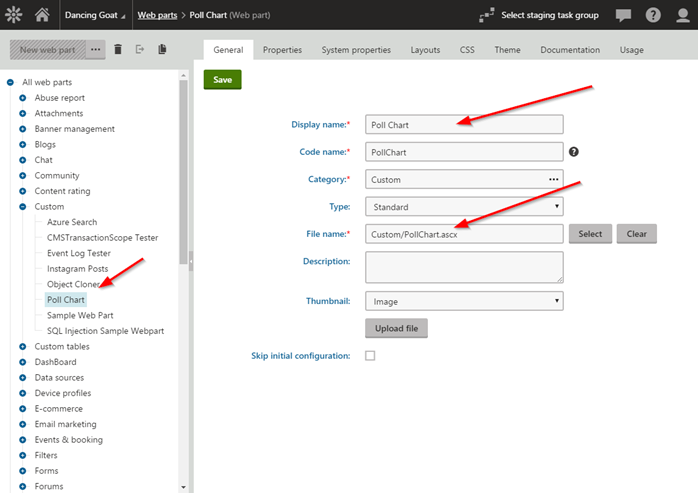
You can find instructions on creating custom web parts here.
2. Choosing a charting control
There are a lot of options when it comes to charting libraries and controls, so you can’t go wrong with any of them. As long as you can submit data easily and logically, it’s up to you to decide which method is best. For my demo, I chose HighchartsJS. It’s a nice, well-documented library with a lot of great features.
I followed the installation instructions here, and added the following to the top of my web part:
    <script src="http://code.highcharts.com/highcharts.js"></script>
    <script src="https://code.highcharts.com/modules/exporting.js"></script>
These libraries would pull in the Highcharts.js functionality from their CDN.
3. Adding a basic chart
After adding the JS libraries, I added a basic chart and set some properties. Note that I added some C# code to the layout for the values I will be setting in the code behind.
    <script>
        $(function () {

            // Radialize the colors
            Highcharts.getOptions().colors = Highcharts.map(Highcharts.getOptions().colors, function (color) {
                return {
                    radialGradient: {
                        cx: 0.5,
                        cy: 0.3,
                        r: 0.7
                    },
                    stops: [
                        [0, color],
                        [1, Highcharts.Color(color).brighten(-0.3).get('rgb')] // darken
                    ]
                };
            });

            $('#pollcontainer').highcharts({
                chart: {
                    plotBackgroundColor: null,
                    plotBorderWidth: null,
                    plotShadow: false,
                    type: 'pie'
                },
                title: {
                    text: '<%= strPollName%>'
            },
            tooltip: {
                pointFormat: '{series.name}: <b>{point.percentage:.1f}%</b>'
            },
            plotOptions: {
                pie: {
                    allowPointSelect: true,
                    cursor: 'pointer',
                    dataLabels: {
                        enabled: true,
                        formatter: function () {
                            if (this.point.name.length > 20) {
                                return '<b>' + this.point.name.substring(0, 15) + '...</b> : ' + Highcharts.numberFormat(this.percentage, 1) + ' %';
                            }
                            else {
                                return '<b>' + this.point.name + '</b> : ' + Highcharts.numberFormat(this.percentage, 1) + ' %';
                            }
                        },
                        style: {
                            color: (Highcharts.theme && Highcharts.theme.contrastTextColor) || 'black'
                        },
                        connectorColor: 'silver'
                    },

                    showInLegend: <%= blnShowLegend.ToString().ToLower()%>
                }
            },
            series: [{
                name: 'Votes',
                colorByPoint: true,
                data: [<%= strPollAnswers%>]
            }]
        });
    });
    </script>
4. Getting the poll data
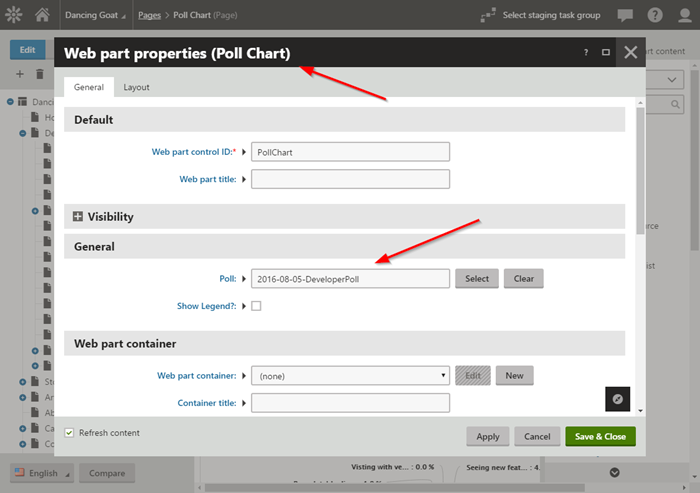
As part of my web part, I added a property that would allow me to select the poll I wanted to display. I also added another setting which will determine if the legend should be displayed.
        #region "Properties"

        /// <summary>
        /// Gets / Sets the poll to chart
        /// </summary>
        public string PollCodeName
        {
            get
            {
                return ValidationHelper.GetString(GetValue("PollCodeName"), "");
            }
            set
            {
                SetValue("PollCodeName", value);
            }
        }

        /// Determines whether the legend is displaed
        /// </summary>
        public bool PollShowLegend
        {
            get
            {
                return ValidationHelper.GetBoolean(GetValue("PollShowLegend"), false);
            }
            set
            {
                SetValue("PollShowLegend", value);
            }
        }


        #endregion
In my web part code-behind, I use the PollInfoProvider API to get the selected poll data.
                    // Get the poll information
                    PollInfo poll = PollInfoProvider.GetPollInfo(this.PollCodeName, CurrentSite.SiteID);
                    if (poll != null)
                    {
                        strPollName = poll.PollQuestion;
                        ...
                    }
Next, I get all of the answers for the poll. I also used the System.Data.DataTable.Compute function to get the total number of votes for the poll.
                        // Gets the poll's answers
                        InfoDataSet<PollAnswerInfo> pollanswers = PollAnswerInfoProvider.GetAnswers(poll.PollID);

                        // Get the total number of answers for the poll
                        int intAnswerCount = ValidationHelper.GetInteger(pollanswers.Tables[0].Compute("Sum(AnswerCount)", ""), 0);
Lastly, I looped through each of the poll answers and calculated the percentage. This, along with the AnswerText, was passed to the Highcharts.JS library as the Series data.
                        if (intAnswerCount > 0)
                        {
                            var list = new List<string>();

                            // Loops through individual poll answers
                            foreach (PollAnswerInfo pollanswer in pollanswers)
                            {
                                list.Add("{name: '" + pollanswer.AnswerText + "',y:" + Math.Round(ValidationHelper.GetDouble((ValidationHelper.GetDouble(pollanswer.AnswerCount, 0) / ValidationHelper.GetDouble(intAnswerCount, 0)) * 100, 0), 2) + "}");
                            }

                            // Set the chart series data
                            strPollAnswers = String.Join(",", list.ToArray());
                        }
5. Testing
With that code in place, I was ready to test. I added the web part to a page and set the poll I wanted to display.
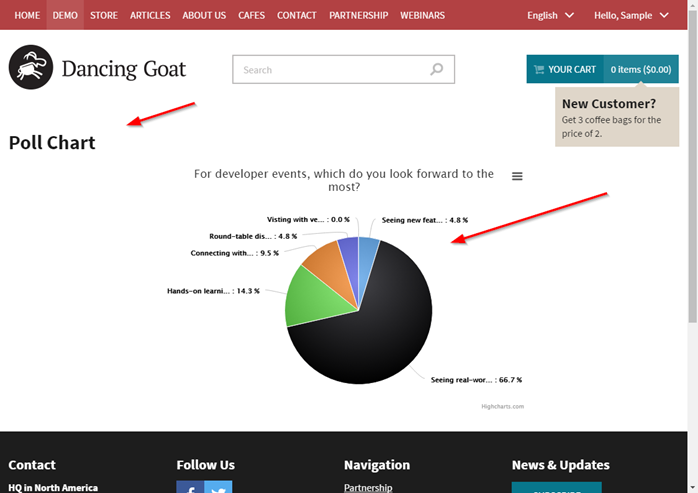
After that, I viewed the live site.
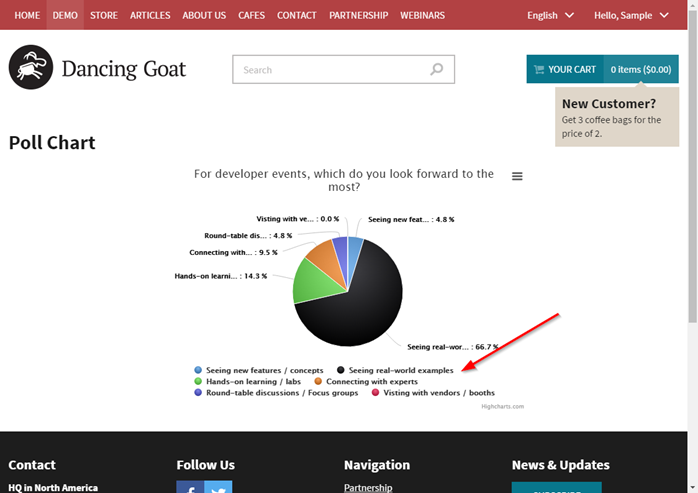
I then updated my web part to display the legend and confirmed it displayed correctly.
Moving Forward
Working charts in Kentico is a pretty easy task that can add some great UI and graphics to your site. I recommend checking out other charting libraries and controls to see which one fits your needs the best. Good luck!
Get the code
Exported web part
This blog is intended for informational purposes only and provides an example of one of the many ways to accomplish the described task. Always consult Kentico Documentation for the best practices and additional examples that may be more effective in your specific situation.