Adding a Google PageSpeed Utility to Kentico
Every website should be designed to load and display information quickly. Regardless of the form factor, the content should be designed to be presented quickly and, of course, look great. Luckily, there’s no shortage of tools to help you ensure your site is as fast as possible. One of the most popular of these tools is the Google PageSpeed Tool. In this blog, I’ll show you how to easily integrate this functionality into your Kentico sites.
So you’ve spent the last year designing, architecting, and building your awesome new site. You have included every JS library known to man so it certainly does some awesome stuff. Your 1TB of images ensure that your content is the highest quality, and that you can see every pixel in your stock images. And then you try it out on a mobile site and realize things have taken a very wrong turn for the worst.
Hopefully, the above scenario is only hypothetical and you are always making sure your sites perform well. You probably have a suite of tools you use, from page speed tests to minification helpers. One of the most popular tools is the Google PageSpeed tool. This utility scans your URL and provides some nice statistics and suggestions to improve performance. The API works by passing the public URL of the page you want to check, along with your Google API key to authenticate. But what if these tools were available within your Kentico sites? That certainly would save you some clicks and help streamline your development process.
In Kentico, you could easily create a new custom module and pull in the Google APIs to use. I wanted to make something a little more integrated, and without the overhead of a whole module. To accomplish this, I made a utility within a stand-alone page and registered it within the Admin UI. Specifically, I wanted to link to this utility through the Validation area of the Pages application. This would allow users to quickly view the PageSpeed information when validating their layout and design.
Creating the page
The first step in the process was to make a new page within my site. I chose to create it in the /CMSModules/Custom folder, but the location is really up to you. I have other modules in that folder and it makes sense to keep them together. Using the existing Validation pages (HTML, CSS, Accessibility, Link Checker), I modelled my new page using the same types / structure. These UI Elements all have the node id passed to them via query string. In my code behind, I used this same functionality to determine the URL for the page I want to check.
// Determine the url of the requested page
if (ValidationHelper.GetInteger(Request.QueryString["nodeid"], 0) > 0)
{
    // Get the node url
    TreeProvider tree = new TreeProvider(MembershipContext.AuthenticatedUser);
    var node = DocumentHelper.GetDocument(ValidationHelper.GetInteger(Request.QueryString["nodeid"], 0), "en-US", tree);

    if (node != null)
    {
        strURL = node.AbsoluteURL;
    }
For my layout, I added some divs to populate with my Google PageSpeed results.
    <h4 class="resultsheader">Page URL
    </h4>
    <div><%=strURL%></div>
    <div class="resultblock">
        <h4 class="resultsheader">Score</h4>
        <div id="score" class="results"></div>
    </div>

    <div class="resultblock">
        <h4 class="resultsheader">Resource Breakdown</h4>
        <div id="resourcebreakdown" class="results"></div>
    </div>
    <div class="resultblock">
        <h4 class="resultsheader">Suggestions</h4>
        <div id="suggestions" class="results"></div>
    </div>
Adding the Google PageSpeed JavaScript
The next step was to add my Google PageSpeed API code. Originally, I added the Google NuGet packages and started developing this using the .NET SDK. I found, however, that the JavaScript implementation was much faster. Additionally, I found some sample code to display some nice charts.
You can see the original JavaScript code here.
There’s a lot of code to the JavaScript, so I’ll just post it here for you to review. Everything is straight from the Getting Started tutorial, with some minor adjustments to the size of the charts and how/when I write the results to the DOM. I’m sure there are much nicer ways to write this code and consume it.
<script>

        var msg;

        // Specify your actual API key here:
        var API_KEY = 'XXXXXXXXXXXXXXXXXXXXXXXXXXXXXXXXXXXXXXX';

        // Specify the URL you want PageSpeed results for here:
        var URL_TO_GET_RESULTS_FOR = '<%=strURL%>';

        var API_URL = 'https://www.googleapis.com/pagespeedonline/v1/runPagespeed?';
        var CHART_API_URL = 'http://chart.apis.google.com/chart?';

        // Object that will hold the callbacks that process results from the
        // PageSpeed Insights API.
        var callbacks = {}

        // Invokes the PageSpeed Insights API. The response will contain
        // JavaScript that invokes our callback with the PageSpeed results.
        function runPagespeed() {
            var s = document.createElement('script');
            s.type = 'text/javascript';
            s.async = true;
            var query = [
              'url=' + URL_TO_GET_RESULTS_FOR,
              'callback=runPagespeedCallbacks',
              'key=' + API_KEY,
            ].join('&');
            s.src = API_URL + query;
            document.head.insertBefore(s, null);
        }

        // Our JSONP callback. Checks for errors, then invokes our callback handlers.
        function runPagespeedCallbacks(result) {
            if (result.error) {
                var errors = result.error.errors;
                for (var i = 0, len = errors.length; i < len; ++i) {
                    if (errors[i].reason == 'badRequest' && API_KEY == 'yourAPIKey') {
                        $('#message').html('<h4 style=\"color: red;\">Message</h4>Please specify your Google API key in the API_KEY variable.');
                        $("#message").slideDown();

                    } else {
                        $('#message').html('<h4 style=\"color: red;\">Message</h4>' + errors[i].message);
                        $("#message").slideDown();
                    }
                }
                return;
            }

            // Dispatch to each function on the callbacks object.
            for (var fn in callbacks) {
                var f = callbacks[fn];
                if (typeof f == 'function') {
                    callbacks[fn](result);
                }
            }
        }

        // Invoke the callback that fetches results. Async here so we're sure
        // to discover any callbacks registered below, but this can be
        // synchronous in your code.
        setTimeout(runPagespeed, 0);

        callbacks.displayPageSpeedScore = function (result) {
            var score = result.score;
            // Construct the query to send to the Google Chart Tools.
            var query = [
              'chtt=Page+Speed+score:+' + score,
              'chs=300x167',
              'cht=gom',
              'chd=t:' + score,
              'chxt=x,y',
              'chxl=0:|' + score,
            ].join('&');
            var i = document.createElement('img');
            i.src = CHART_API_URL + query;
            $('#score').html(i);
            //document.body.insertBefore(i, null);
        };

        callbacks.displayTopPageSpeedSuggestions = function (result) {
            var results = [];
            var ruleResults = result.formattedResults.ruleResults;
            for (var i in ruleResults) {
                var ruleResult = ruleResults[i];
                // Don't display lower-impact suggestions.
                if (ruleResult.ruleImpact < 3.0) continue;
                results.push({
                    name: ruleResult.localizedRuleName,
                    impact: ruleResult.ruleImpact
                });
            }
            results.sort(sortByImpact);
            var ul = document.createElement('ul');
            for (var i = 0, len = results.length; i < len; ++i) {
                var r = document.createElement('li');
                r.innerHTML = results[i].name;
                ul.insertBefore(r, null);
            }
            if (ul.hasChildNodes()) {
                //document.body.insertBefore(ul, null);
                $('#suggestions').html(ul);
            } else {
                var div = document.createElement('div');
                div.innerHTML = 'No high impact suggestions. Good job!';
                $('#suggestions').html(div);
            }
        };

        // Helper function that sorts results in order of impact.
        function sortByImpact(a, b) { return b.impact - a.impact; }

        var RESOURCE_TYPE_INFO = [
  { label: 'JavaScript', field: 'javascriptResponseBytes', color: 'e2192c' },
  { label: 'Images', field: 'imageResponseBytes', color: 'f3ed4a' },
  { label: 'CSS', field: 'cssResponseBytes', color: 'ff7008' },
  { label: 'HTML', field: 'htmlResponseBytes', color: '43c121' },
  { label: 'Flash', field: 'flashResponseBytes', color: 'f8ce44' },
  { label: 'Text', field: 'textResponseBytes', color: 'ad6bc5' },
  { label: 'Other', field: 'otherResponseBytes', color: '1051e8' },
        ];

        callbacks.displayResourceSizeBreakdown = function (result) {
            var stats = result.pageStats;
            var labels = [];
            var data = [];
            var colors = [];
            var totalBytes = 0;
            var largestSingleCategory = 0;
            for (var i = 0, len = RESOURCE_TYPE_INFO.length; i < len; ++i) {
                var label = RESOURCE_TYPE_INFO[i].label;
                var field = RESOURCE_TYPE_INFO[i].field;
                var color = RESOURCE_TYPE_INFO[i].color;
                if (field in stats) {
                    var val = Number(stats[field]);
                    totalBytes += val;
                    if (val > largestSingleCategory) largestSingleCategory = val;
                    labels.push(label);
                    data.push(val);
                    colors.push(color);
                }
            }
            // Construct the query to send to the Google Chart Tools.
            var query = [
              'chs=300x140',
              'cht=p3',
              'chts=' + ['000000', 16].join(','),
              'chco=' + colors.join('|'),
              'chd=t:' + data.join(','),
              'chdl=' + labels.join('|'),
              'chdls=000000,14',
              'chp=1.6',
              'chds=0,' + largestSingleCategory,
            ].join('&');
            var i = document.createElement('img');
            i.src = 'http://chart.apis.google.com/chart?' + query;
            $('#resourcebreakdown').html(i);

        };
    </script>
Registering the page
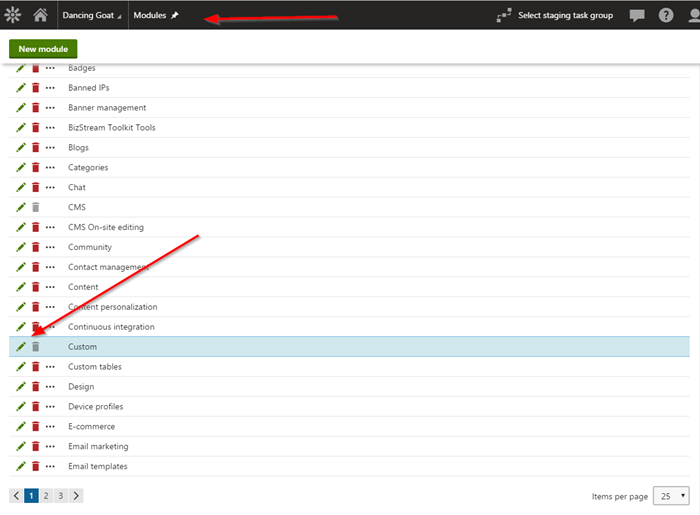
After adding my page and API code, I needed to register it within the Kentico Admin UI. I wanted this utility to display along with the other validation tools, so I opened the Modules application and selected Custom.

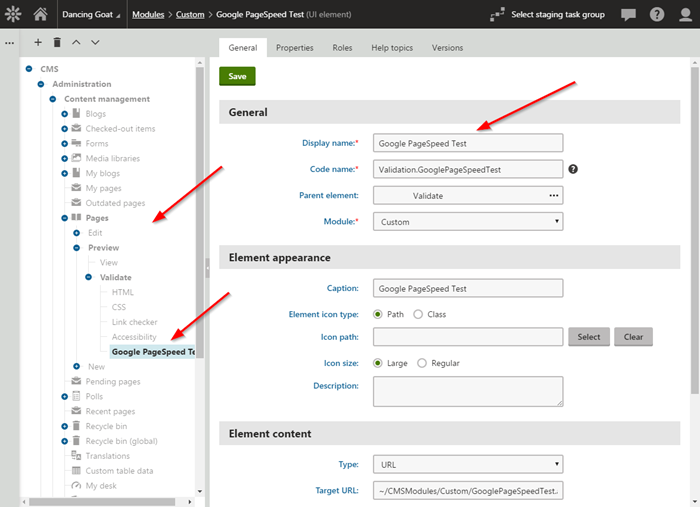
On the UI interface tab, I browsed to CMS/Administration/Content management/Pages/Preview/Validate and added a new element named Google Page Speed Test.

For the Element content fields, I selected URL and added the path to my new page. Note that I included the nodeid parameter in the URL.
~/CMSModules/Custom/GooglePageSpeedTest.aspx?nodeid={%nodeid%}
This path would ensure the node id for the current page is passed to the page. This node id will be used to determine the public URL to send to the Google API.
Testing
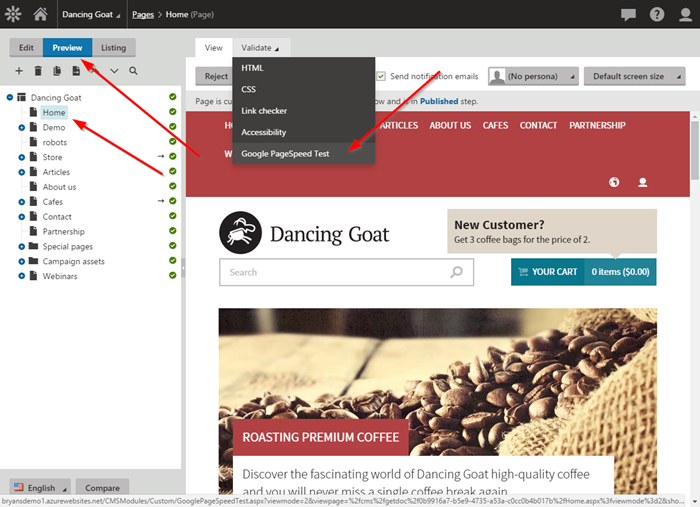
To test the integration, I navigated to my Pages application and selected the Home page. I then clicked Preview to access the Validate menu. I confirmed the Google PageSpeed Test option was displayed.

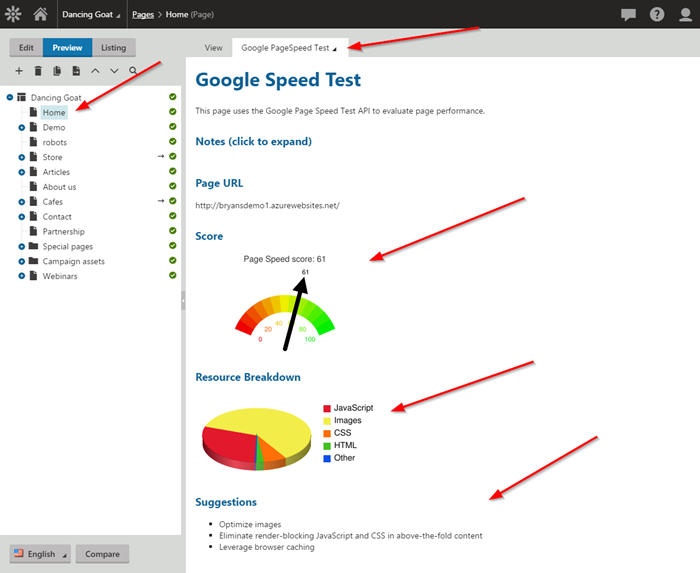
I clicked the Google PageSpeed Test option, which executed the JavaScript to test the page. I confirmed the results from the Google PageSpeed API.

In the results, you can see the overall score, what resources are impacting performance, and a list of suggestions to improve the loading of the content.
Notes
- Because Google needs to be able to access the url of the page, this will utility will not work on localhost unless you use a tool like ngrok.
- The Google PageSpeed API may take a few seconds to return values, depending on the complexity of your page and design.
- The node asolute URL (from the code-behind) will pull the last published version of the page.
- If you are using workflow, you could update the code to pull the preview URL to test changes before the page is published.
Moving forward
Hopefully, this blog showed you how easily you can integrate your performance tools directly into your Kentico sites. With the Google PageSpeed Tool available from the Pages application, your designers can quickly evaluate the page load speed and address any performance issues. The example I have is very basic, so I encourage you to check out the Google API for more examples and techniques. Good luck!
Get the code
This blog is intended for informational purposes only and provides an example of one of the many ways to accomplish the described task. Always consult Kentico Documentation for the best practices and additional examples that may be more effective in your specific situation.