5 Tips for Debugging Kentico
For a .NET developer, working with Kentico is usually a straight-forward process. Thanks to extensive documentation, dedicated support, and loads of blog posts from the community, finding help is relatively easy. Sometimes, no matter who you talk to, you still need to understand more about what’s happening with your site to solve your issue. Luckily, there are quite a few debugging options within the platform to help you get answers. In this blog, I’ll cover some of these tools, and hopefully help you move forward with your development.
Every developer has hit a brick wall in a project. Whether it’s a phantom error no one can reproduce, or a new web part that melts your CPU, there’s never a shortage of things to go haywire in any Kentico site. Often, the most valuable tool to fight these battles is knowledge. With a deep understanding of the constants and variables of any situation, you can quickly diagnose and resolve the issue.
Along with a ton of great features and capabilities, Kentico has several powerful debugging layers behind the scenes. Knowing when and where to use these utilities can help you resolve your site issues quickly. In this blog, I’ll give you a few tips to debugging your sites.
Debug Log to file
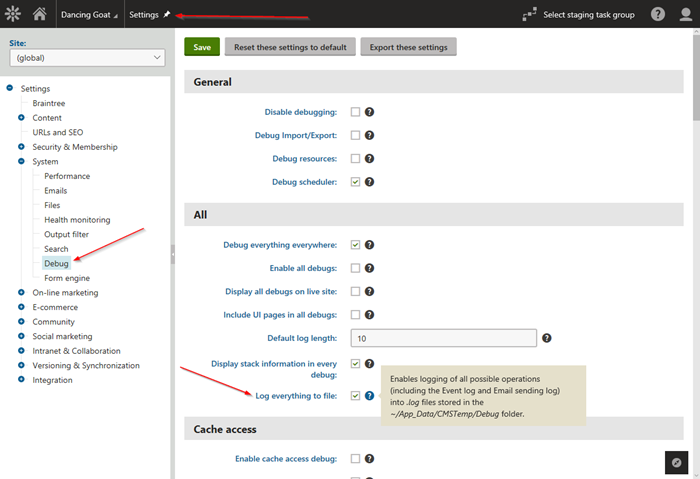
You’re probably well-aware of the Debug module inside Kentico. This built-in resource lets you track just about every action within the site, and provides some great information on how the application is performing. Under the hood, enabling Kentico Debugging starts a data collection process for SQL calls, object changes, and tons of other actions. This data is stored in memory, and then displayed when you view the Debug reports.
In some cases, it may help you to store this data in a physical file. This can be especially useful if you need to analyze the data offline, import it into a 3rd party system, or maybe send to a colleague for review.
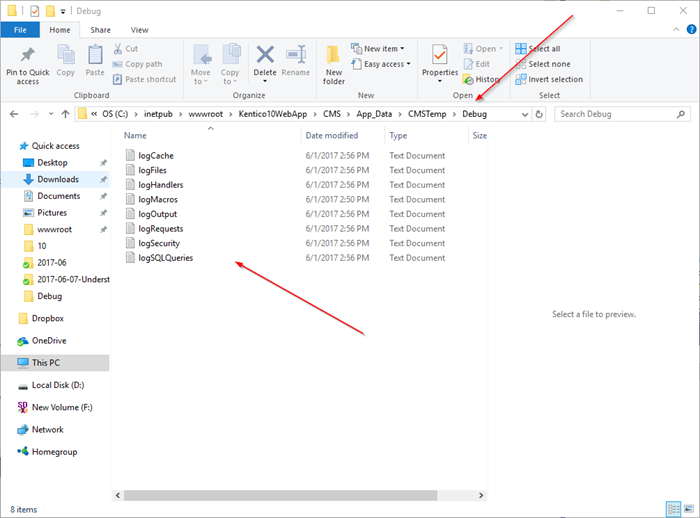
Here are the files the system creates within the filesystem.
Show complete context
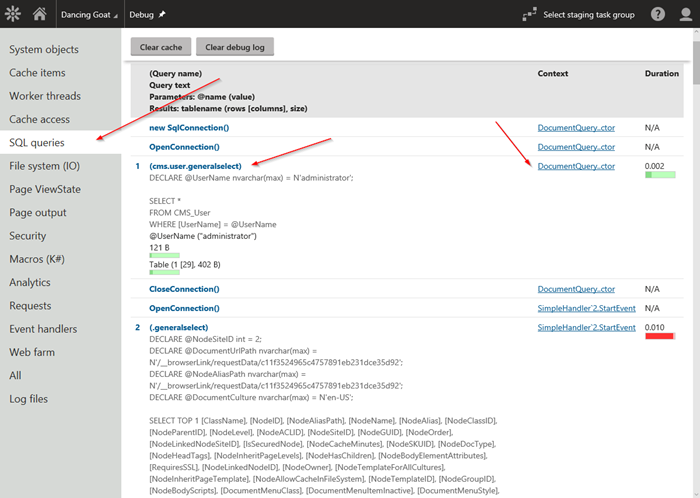
Speaking of the Debug module, another great feature is the Show complete context option. When you enable debugging, Kentico starts collecting a lot of information. When you view the reports, it only shows you a subset in order to give you the most important parts. In your development, understanding every aspect of what’s going on is never a bad thing, so enabling the Show complete context option is a great way to get the bigger picture.
Here is a standard SQL Debugging report.
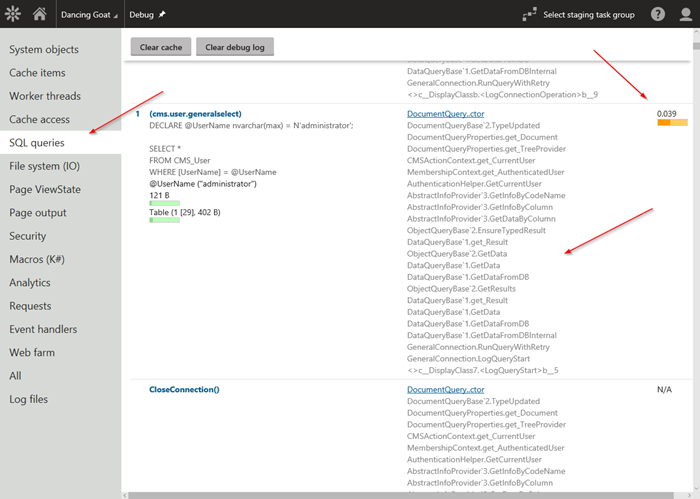
And here is one with the full details displayed.
LogEmails
While the Debug module helps you log data, emails are often another source of mystery when it comes to resolving site issues. Using the Email Queue is certainly a great way to see what emails are being sent and their status, but you may need to get the information in an offline format. To help with this, you can enable the CMSLogEmails web.config key. This setting stores email information in a physical file that you can share with the rest of your team.
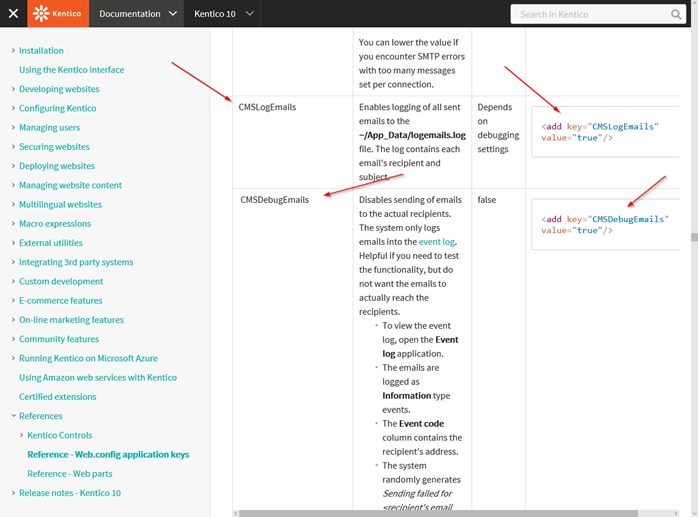
You can learn more about Kentico web.config application settings here.
Bonus:
If you want to log your emails and not actually send them, enable the CMSDebugEmails setting to disable their delivery. This can be especially helpful if you are testing out a newsletter issue or similar action.
Macro Benchmark utility
Ah, macros. So powerful, yet so misunderstood. Kentico has a very extendable API, and macros are often the goto tool for developers. You can easily create a function that can be called throughout the system, making integration and customization a cinch. But what do you do when your macro is killing your site performance? Luckily, the Macro Benchmark tool can help you understand how your macro is functioning under load.
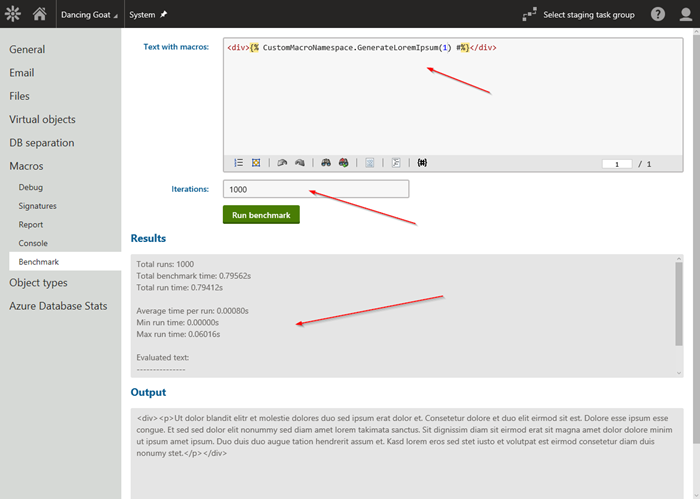
Using this tool, you can figure out how your macro is affecting performance and overall system health. This is very helpful when you have a lot of macros in your site and your users are reporting slow performance.
Event logging
Understanding what is happening is critical in any debugging situation. Without real-time knowledge, you are just guessing as to what the cause may be. Because of the platforms great event capturing functionality, logging to the Kentico Event Log is a very simple process. By leveraging the various logging methods in your code, you can get step-by-step reporting in your modules, scheduled tasks, and other custom code. This information can be essential in diagnosing issues and resolving problems.
            try
            {
                …
            }
            catch (Exception ex)
            {
                EventLogProvider.LogException("CustomWorkflowNotification", "SendWorkflowNotification", ex);
            }
You can check out more about more about Event Logging in a previous blog I wrote here.
Moving forward
Hopefully, this article showed you some of the debugging tools available to you when you are working with Kentico. As a platform, Kentico strives to be as accessible as possible, providing you info about what is happening every step of the way. Using these features, you should be able to diagnose problems quickly and resolve your issues. Good luck!