System information UI |

|

|

|

|
|
System information UI |

|

|

|

|
|
|
||
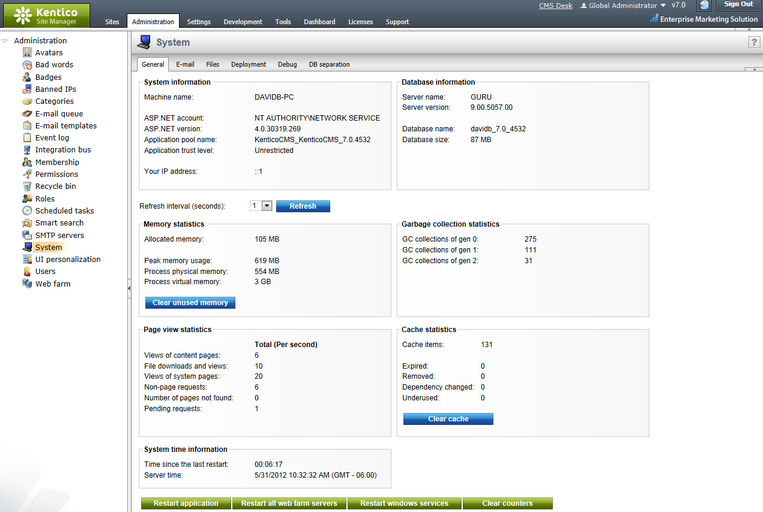
On the General tab in Site Manager -> Administration -> System, you can find general information about the system and the environment in which it is running. The following information and actions are available on the tab:
•Machine name - name of the machine on which the system is running.
•ASP.NET account - name of the user account used by ASP.NET in the operating system on your machine.
•ASP.NET version - version of ASP.NET on which the system is running.
•Application pool name - name of the application pool in which this instance of Kentico CMS is running.
•Application trust level - trust level of the environment where the application is running.
•Your IP address - IP address from which you are accessing the system.
•Server name - name of the database server on which the system database is running.
•Server version - version of SQL Server installed on the database server.
•Database name - name of the system database on the database server.
•Database size - current size of the database, including the actual database data (the .mdf file) and the database log (the .ldf file).
|
Contact management database separation
If the application has a separated contact management (on-line marketing) database, the information will be displayed for both databases. |
Using the Refresh interval (seconds) drop-down list, you can set the interval after which the values in the sections below will be refreshed.
•Allocated memory - size of memory allocated for the CMS.
•Peak memory usage - maximum memory used by the process.
•Process physical memory - physical memory used by the process.
•Process virtual memory - memory allocated by the process in the virtual memory space.
•Clear unused memory - clicking this button clears unused data stored in the memory so that more free memory is available.
•GC collection of gen 0 - number of unused memory cleanings initiated by the garbage collector for generation 0 objects.
•GC collection of gen 1 - number of unused memory cleanings initiated by the garbage collector for generation 1 objects.
•GC collection of gen 2 - number of unused memory cleanings initiated by the garbage collector for generation 2 objects.
•View of content pages - number of content pages displayed since last restart.
•File downloads and views - number of files downloaded and viewed since last restart.
•Views of system pages - number of system pages viewed since last restart.
•Non-page requests - number of non-page requests handled since last restart.
•Number of pages not found - number of page view requests which resulted in the 404: Page Not Found error since the last restart.
•Pending requests - number of currently pending (not yet processed) page requests.
•Cache items - number of items in the system cache.
•Expired - number of expired cache items in the system cache.
•Removed - number of items removed from the system cache since last restart.
•Dependency changed - cache items dropped based on the change of their dependencies.
•Underused - cache items dropped earlier than configured, possible due to lack of memory.
•Clear cache - clears all items stored in the cache.
•Time since last restart - time since the system was last restarted (or since it was launched if no restart was performed).
You can also perform the following actions using the buttons at the bottom part of the tab:
•Restart application – restarts Kentico CMS (in need to take effects of some changes).
•Restart all web farm servers - restarts all web farm servers running this instance of Kentico CMS. This action is only displayed when the system is configured to run in web farm environment. See Modules -> Web farm synchronization for more details.
•Restart windows services - restarts all Kentico CMS Windows services related to this instance. This action is only displayed when there is at least one Windows service installed for this instance of Kentico CMS. See External utilities -> Service Manager for more details.
•Clear counters - clears the values currently stored in all performance counters registered for the current Kentico CMS instance. See Modules -> Health monitoring for more details. Clicking this button also resets the Page view statistics section of this tab.
