|
|

Using web analytics reports |

|

|

|

|
|
Using web analytics reports |
|
|

|
|
|
|
Using web analytics reports |
|
|
|
|
|
Using web analytics reports |
|
|
|
|
|
|
||
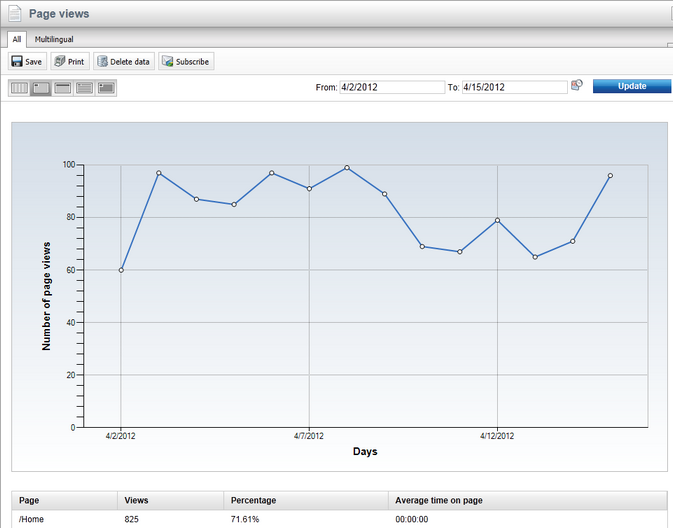
The data logged for web analytics statistics is presented in highly flexible reports that contain various kinds of charts and tables. The same type of reports are also used to display the results of other related on‑line marketing features, such as campaigns and website optimization tests.
When viewing a web analytics report, the From and To fields on the right can be used to enter a time period. Only hits that were logged for the statistic during the specified interval will be included in the displayed data.
The following options allow you to choose which unit of time should be used in the report:
•![]() Hour
Hour
•![]() Day
Day
•![]() Week
Week
•![]() Month
Month
•![]() Year
Year
This selection determines the length of time which is represented by individual units in the report's graphs (if there are any) and the precision that can be specified in the From and To fields.
The following actions may also be performed for every report:
•![]() Save - saves the report in its current state (according to the selected time interval). To view saved reports at a later time, go to CMS Desk -> Tools -> Reporting, select the matching report under the appropriate category and switch to the Saved reports tab.
Save - saves the report in its current state (according to the selected time interval). To view saved reports at a later time, go to CMS Desk -> Tools -> Reporting, select the matching report under the appropriate category and switch to the Saved reports tab.
•![]() Print - allows the report to be printed. The available options depend on the used browser.
Print - allows the report to be printed. The available options depend on the used browser.
•![]() Delete data - may be used to clear the data measured for the given statistic. Please note that this permanently removes the data from the database. This action is only available for users who have the Manage data permission for the Web analytics module.
Delete data - may be used to clear the data measured for the given statistic. Please note that this permanently removes the data from the database. This action is only available for users who have the Manage data permission for the Web analytics module.
•![]() Subscribe - opens a new dialog where you can subscribe to the report. Subscribing allows you to periodically receive e‑mails with the up‑to‑date content of the given report. It is also possible to subscribe to a specific reporting component (graph or table) by right clicking on it and selecting the Subscribe to option in the displayed context menu.
Subscribe - opens a new dialog where you can subscribe to the report. Subscribing allows you to periodically receive e‑mails with the up‑to‑date content of the given report. It is also possible to subscribe to a specific reporting component (graph or table) by right clicking on it and selecting the Subscribe to option in the displayed context menu.
The data displayed in the reports may also be exported into external files using various formats. This can be done by right clicking on a graph or table in the given report, which will open a context menu offering the following export options:
•![]() Export to Excel - exports the data displayed by the given object to an XLSX spreadsheet.
Export to Excel - exports the data displayed by the given object to an XLSX spreadsheet.
•![]() Export to CSV - exports data to a CSV file.
Export to CSV - exports data to a CSV file.
•![]() Export to XML - exports data to an XML file.
Export to XML - exports data to an XML file.
After you select an action from the menu, your browser's standard file download dialog will pop up, letting you open or save the file with the exported data just like when downloading any other type of file.