|
|

Analyzing A/B test results |

|

|

|

|
|
Analyzing A/B test results |
|
|

|
|
|
|
Analyzing A/B test results |
|
|
|
|
|
Analyzing A/B test results |
|
|
|
|
|
|
||
The data gathered during the course of A/B testing may be viewed in reports that display various types of conversion metrics. To access the main interface containing these reports, go to CMS Desk -> On-line marketing -> Web analytics and expand the Optimization -> A/B tests category.
Here you can check the results of the A/B testing actions performed according to the instructions in the Example: Sample A/B test topic. Because of the way the analytics log is processed, you may have to wait approximately one minute before conversion hits are reflected in the reports.
A/B testing reports use the same basic format as all other web analytics reports, so please refer to Web analytics -> Using web analytics reports for details about the actions that can be used to filter or otherwise manage the displayed data.
The Conversions drop‑down list may be used to select which conversion's statistics should be displayed. Please note that the system logs all conversion hits generated by visitors who have passed through a page where an A/B test is running. If there are many conversions defined on your website, only those that can somehow be affected by the differences in the A/B test's page variants will contain relevant data.
Data in the reports is represented by two possible types of graphs. The line charts show the progress of a certain conversion statistic over time and display combined data for all of the A/B test's variants. The bar graphs contain details for individual units of time according to the selected report type (hours, days, months etc.). You may also view the conversion data in a table located between the graphs. Each row in the table shows the data logged for a specific page variant, both for the time period currently displayed by the report and the entire duration of the test.
The following reports are available for A/B testing:
Overview |
This report can be used to view the progress of the primary metrics measured for the site's A/B tests from a single location. |
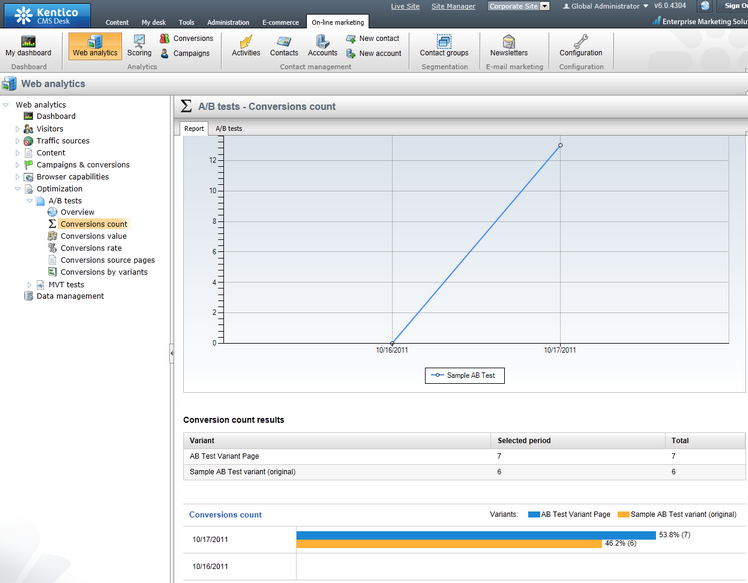
Conversions count |
Displays the number of conversion hits logged for the selected A/B test during the specified time interval.
In the bar graph, the number of conversion hits is divided into categories that represent individual page variants. This allows you to compare the A/B test's variants and determine which one generated the most conversions (in absolute terms). |
Conversions value |
Displays the sum of the conversion values logged for the selected A/B test during the specified time interval.
In the bar graph, the conversion values are divided into categories that represent individual page variants, which allows you to determine which variant generated the highest total conversion value. This way you can easily evaluate an A/B test's variants when using weighted conversions that have a different level of importance. |
Conversions rate |
Used to indicate how many visitors who access the tested page perform a conversion. The conversion rate is calculated as the amount of logged conversion hits divided by the total number of visitors on the variants of the tested page.
If you select the (all) option from the Conversions drop‑down list, then the rate will be measured for all possible conversions, i.e. as the percentage of visitors who generated at least one conversion hit of any type.
The conversion rate in the bar graph is displayed for individual page variants. This allows you to compare the A/B test's variants and determine which one encouraged the highest share of its visitors to perform a conversion. |
Conversions source pages |
Displays hit statistics for individual conversions that were logged as part of the selected A/B test during the specified time interval.
The data logged for the chosen conversion is categorized according to the page variants defined for the given A/B test. This allows you to easily determine which variant generated the most conversion hits of the selected type. |
Conversions by variants |
Displays details of the number of hits logged for each conversion by individual page variants defined for the selected A/B test. You can select the variant that you wish to evaluate from the Variants drop‑down list.
The hits logged for the chosen variant are divided into categories that match individual conversions. This allows you to easily measure which conversions are performed most commonly by visitors assigned to the selected page variant. |
|
Reports for individual A/B tests
These reports can also be viewed when editing the original page of an A/B test in CMS Desk -> Content -> Edit -> Analytics -> A/B testing -> Reports.
The same options are available as described for the web analytics interface, but statistics are only displayed for the currently edited A/B test. |
