|
|

Web analytics reports |

|

|

|

|
|
Web analytics reports |
|
|

|
|
|
|
Web analytics reports |
|
|
|
|
|
Web analytics reports |
|
|
|
|
|
|
||
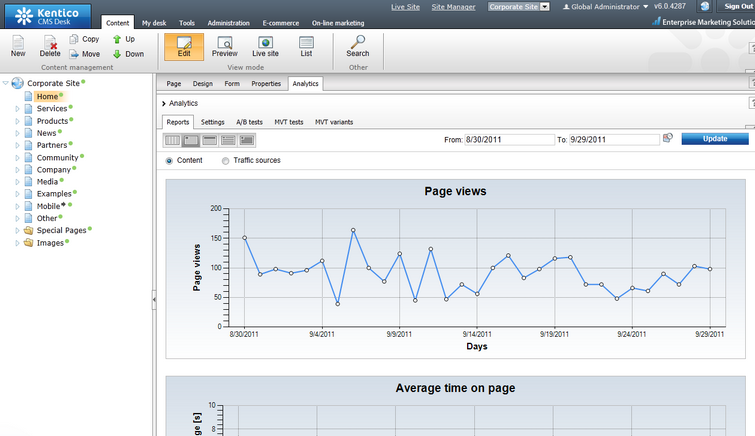
The data logged by the web analytics module can be viewed and analyzed using reports displayed in the CMS Desk -> Tools -> Web analytics interface.
The reports are organized in a tree menu that can be used for navigation.
The first item in the tree is a Dashboard page, which may be personalized to display unique content for individual users. This way, users can quickly access graphs or tables containing data of the statistics that they need most frequently, view side‑by‑side comparisons, etc. This can be done by adding (![]() ) the Analytics chart viewer or Analytics table viewer widgets from the Reporting category, and configuring their properties to display the desired graph or table from a specific report.
) the Analytics chart viewer or Analytics table viewer widgets from the Reporting category, and configuring their properties to display the desired graph or table from a specific report.
Reports that track the statistics and events described in the table below are included in the web analytics tree menu by default:
Visitors |
|
Countries |
This statistic shows from which countries visitors access the website.
The countries are recognized according to the IP addresses of visitors, which may not be 100% reliable in all cases, but the overall statistics for a high number of visits should provide correct results. |
Visitors |
Displays the number of unique visits on the website that occurred over the specified time period. A single visit includes any number of page views or other actions performed by a specific user during one session.
Also displayed is the ratio between the number of new and returning visitors. A visitor is considered as returning after being inactive for the amount of minutes specified in the Site Manager -> On‑line marketing -> Web analytics -> Visitor idle time (minutes) setting. Visitors are recognized according to the presence of a browser cookie.
Visitors may additionally be tracked according to their IP address. To enable this functionality, enter a value greater than 0 into the Remember visitors by IP (minutes) setting. This ensures that visitors will be remembered for the specified number of minutes even if their browser does not save cookies. |
Registered users |
Displays the total amount of new users that registered on your website during the specified time period, as well as the names and IDs of individual users. |
Search crawlers |
Displays the number of pages that were visited by search engine web crawlers (robots). Statistics are also provided for individual types of crawlers.
Tracking is only done for crawlers whose user agent is specified for one of the search engines registered in the system. Please see Monitoring traffic from search engines for more information. |
Mobile devices |
Displays the number of visitors who accessed the website using a mobile device. The report also provides a comparison between the number of mobile and standard visits, as well as detailed statistics for individual types of mobile devices. |
Traffic sources |
|
All traffic sources |
Displays the number of page views that the website received, categorized according to the type of the traffic source. Three different types of sources are tracked:
•Direct - page views gained when the URL of one of the website's pages is entered directly into the browser (i.e. no referrer was passed). •Referring sites - page views gained through links from external websites (not including search engine result pages). •Search engines - views generated by search engines.
References from the website's local pages (e.g. navigation menus) are not included in this statistic. |
Referrals |
Lists the full URLs of external pages from which visitors followed links to your website. You can also see the number of page views gained from each referring URL.
Note: After applying hotfix 7.0.25 or newer, referrals do not include search engine result pages. The system excludes all URLs that match the Domain rule of one of the search engines defined in Site Manager -> Development -> Search engines. |
Referring sites |
Displays the total amount of page views gained through links from external websites. You can view the statistics for individual website domains.
Note: After applying hotfix 7.0.25 or newer, referring sites do not include search engines. The system excludes all websites whose URLs match the Domain rule of one of the search engines defined in Site Manager -> Development -> Search engines. |
Search engines |
Displays the amount of page views generated by visitors who found the website through a search engine, as well as the statistics of individual engines.
See Monitoring traffic from search engines for more details. |
Search keywords |
Displays which keywords were entered into search engines in order to find the website and the amount of page views generated by individual keywords. |
Content |
|
Aggregated views |
This statistic tracks access to pages via links in RSS or Atom feeds created using the Syndication module. On the All tab, the total number of pages viewed this way is displayed, as well as the statistics of individual documents.
The Multilingual tab contains the same type of data, but page views are categorized and displayed separately according to the content culture of the given pages. |
File downloads |
Displays the number of files downloaded by website visitors and the statistics for individual files. On the All tab, the total statistics are shown for all files regardless of their assigned content culture.
The Multilingual tab contains the same type of data, but the number of downloads for files belonging to different content cultures is tracked and displayed separately.
Please note that only files stored as documents in the website's content tree are tracked. |
Invalid pages |
Tracks page requests that contain the website's domain name, but specify a path to a page that does not exist. The total amount of invalid requests logged during the specified time period can be viewed, and the paths and statistics of individual requests are also displayed. |
On-site search keywords |
Displays the total number of searches that were performed using the website's local search functionality and the keywords that were entered. |
Page views |
Monitors how many times the website's pages were viewed by visitors. On the All tab, the displayed data includes the total amount of views for the entire website, and specific information for individual pages. If a page is available in multiple content cultures, the view count of all its versions is added together and tracked as a single page.
The Multilingual tab contains the same type of data, but the views of pages that belong to different content cultures are tracked and displayed separately.
Only pages that are served by Kentico CMS are included in the statistics. |
Top landing pages |
Displays which pages are the first ones viewed by visitors when they start their browsing session on the website. On the All tab, all culture versions of particular landing pages are tracked together as a single page.
The Multilingual tab may be used to view separate statistics for individual page versions that belong to different content cultures. |
Top exit pages |
Keeps track of the final pages that were visited by users when their browsing session ended. On the All tab, all culture versions of particular exit pages are tracked together as a single page.
The Multilingual tab may be used to view separate statistics for individual page versions that belong to different content cultures. |
Campaigns & conversions |
|
Campaigns |
This category contains reports used to track the progress of marketing campaigns and evaluate their results. Further information can be found in the Campaigns sub‑chapter. |
Conversions |
Displays the number of conversions that were performed on the entire website by users over the specified time period. The statistics of individual conversions are also included. To learn more about conversions, please see the Conversions sub‑chapter. |
Browser capabilities |
|
Browser types |
This statistic shows what type of browsers are used by visitors to view the website. The name and version number of each visitor's browser is logged, for example: FireFox3.6 |
Please note: The statistics below can only be tracked for visitors who access a page that contains the Analytics browser capabilities web part. |
|
Flash support |
Tracks if the browsers used by visitors support viewing of Flash animations and videos. |
Java support |
Tracks if the browsers used by visitors support Java applets. |
Operating system |
This statistic logs which operating systems are used by the website's visitors. |
Silverlight support |
Tracks if the browsers used by visitors support Microsoft Silverlight. |
Screen colors |
Tracks the color depth that can be displayed in the visitors' browsers. |
Screen resolution |
Logs the screen resolution used by the website's visitors. |
|
Tracking browser capabilities
If you wish to log detailed browser information other than the type and version, it is necessary to use the Web analytics -> Analytics browser capabilities web part. You can choose which statistics should be tracked by configuring the properties of the web part.
This web part utilizes JavaScript to collect the necessary data, which may in some cases interfere with other scripts on the page, so it is up to the website's developers to determine where it should be located.
To provide the most accurate statistics, it is recommended to place the web part on a page that most visitors will pass through, such as the website's default page or a frequently used landing page. |
The reports in the Optimization category are used to display the statistics of page optimization tests. Information about these sections can be found in the chapters dedicated to the A/B testing and Multivariate testing modules.
When a statistic is selected from the tree menu in the web analytics interface, its report will be displayed on the right. For most statistics, the data is organized into a graph showing the hits measured over time and a table containing detailed information for individual objects.
The From and To fields on the right can be used to enter a time period for the report. Only hits that were logged for the statistic during the specified interval will be included in the displayed data.
The following options allow you to choose which unit of time should be used in the statistic's report:
•![]() Hour
Hour
•![]() Day
Day
•![]() Week
Week
•![]() Month
Month
•![]() Year
Year
This selection determines the length of time which is represented by individual units on the horizontal axis of the report's graphs (if there are any) and the precision that can be specified in the From and To fields.
The following actions may also be performed for every report:
•![]() Save - saves the report in its current state (according to the selected time interval). To view saved reports at a later time, go to CMS Desk -> Tools -> Reporting, select the matching report under the Web analytics category and switch to the Saved reports tab.
Save - saves the report in its current state (according to the selected time interval). To view saved reports at a later time, go to CMS Desk -> Tools -> Reporting, select the matching report under the Web analytics category and switch to the Saved reports tab.
•![]() Print - allows the report to be printed. The available options depend on the used browser.
Print - allows the report to be printed. The available options depend on the used browser.
•![]() Delete data - clears all data measured for the given statistic. Please note that this permanently removes all of the statistic's hits from the database. This action is only available for users who have the Manage data permission for the Web analytics module. It is also possible to delete data for all statistics at once, as described in the Managing analytics data topic.
Delete data - clears all data measured for the given statistic. Please note that this permanently removes all of the statistic's hits from the database. This action is only available for users who have the Manage data permission for the Web analytics module. It is also possible to delete data for all statistics at once, as described in the Managing analytics data topic.
•![]() Subscribe - opens a new dialog where you can subscribe to the report. Subscribing allows users to periodically receive e‑mails with the up‑to‑date content of the given report. It is also possible to subscribe to a specific reporting component (graph or table) by right clicking on it and selecting the Subscribe to option in the displayed context menu.
Subscribe - opens a new dialog where you can subscribe to the report. Subscribing allows users to periodically receive e‑mails with the up‑to‑date content of the given report. It is also possible to subscribe to a specific reporting component (graph or table) by right clicking on it and selecting the Subscribe to option in the displayed context menu.
The data displayed in the reports may also be exported into external files using various formats. This can be done by right clicking on a graph or table in the given report, which will open a context menu offering the following export options:
•![]() Export to Excel - exports the data displayed by the given object to an XLSX spreadsheet.
Export to Excel - exports the data displayed by the given object to an XLSX spreadsheet.
•![]() Export to CSV - exports data to a CSV file.
Export to CSV - exports data to a CSV file.
•![]() Export to XML - exports data to an XML file.
Export to XML - exports data to an XML file.
After you select an action from the menu, your browser's standard file download dialog will pop up, letting you open or save the file with the exported data just like when downloading any other type of file. For more details on the data export feature, please refer to the Modules -> UI data export chapter of this guide.
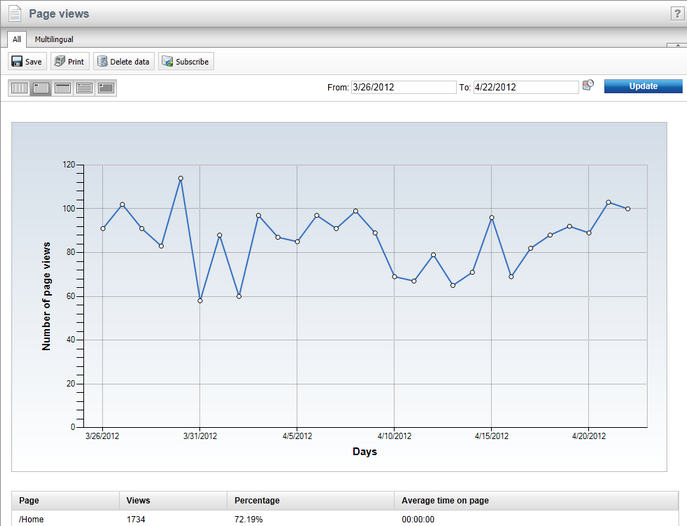
It is also possible to view the values of web analytics statistics measured for specific website pages. To do this, go to CMS Desk -> Content -> Edit and select the document representing the page that you wish to examine. Then switch to the Analytics tab and select Reports.
A time interval can be specified for the reports here and their data may be exported in the same way as when using the main web analytics interface.
The reports for each page are divided into two categories:
•Content:
Page views |
Shows how many times the given page was accessed by the website's visitors during the specified time interval. |
Average time on page |
Displays the average time that visitors spend viewing the given page (measured in seconds). |
Landing page |
Counts how many times the given document served as a landing page for the website's visitors. A landing page is the first page viewed when a visitor starts their browsing session on the website. |
Exit page |
Counts how many times the document was an exit page for a visitor. An exit page is defined as the last page visited by a user before their browsing session ended. |
•Traffic sources:
Traffic sources |
Displays the statistics of the traffic sources that generated the document's page views. Four different types of sources are tracked:
•Direct - page views gained when the URL of the page was entered directly into the browser (i.e. no referrer was passed). •Referring local pages - views gained as a result of references (links) from other pages on the given website (e.g. through a navigation menu). •Referring sites - views gained through links from external websites (not including search engine result pages). •Search engines - views generated by visitors who found the page using a search engines. |
Search engines |
This table contains the names of the search engines that visitors used to find the given page and the amount of page views generated by each engine. |
Search keywords |
Contains the keywords that were entered into search engines in order to find the page and the page view statistics of individual keywords. |
Referring sites |
Displays the domain names of external sites from which visitors were linked to the given page. You can view the statistics for individual sites.
Note: After applying hotfix 7.0.25 or newer, referring sites do not include search engines. The system excludes all websites whose URLs match the Domain rule of one of the search engines defined in Site Manager -> Development -> Search engines. |
Referring local pages |
Contains the alias paths of the local website's pages from which visitors were linked to the given page and the amount of views gained from each page. |
Crawlers |
Shows how many times and how recently the page was visited by search engine web crawlers (robots).Tracking is only done for crawlers whose user agent is specified for one of the search engines registered in the system. |
