|
|

SQL queries |

|

|

|

|
|
SQL queries |
|
|

|
|
|
|
SQL queries |
|
|
|
|
|
SQL queries |
|
|
|
|
|
|
||
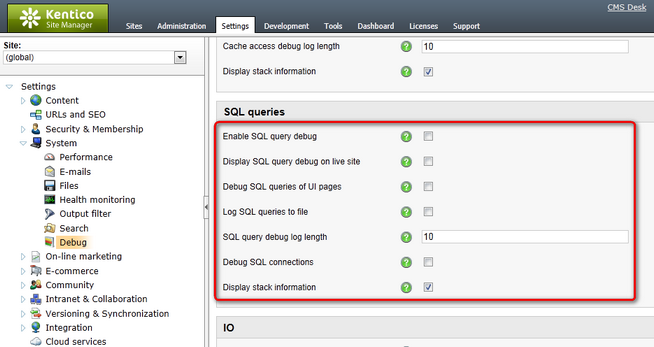
SQL query debugging can be turned on and configured either by adjusting certain settings in Site Manager -> Settings -> System -> Debug, or by adding certain keys into the AppSettings section of your web.config file. The following table lists and explains these settings and keys:
Setting |
Web.config key |
Description |
Enable SQL query debug |
CMSDebugSQLQueries |
Enables SQL query debugging and the SQL queries tab in Site Manager -> Administration -> System -> Debug. |
Display SQL query debug on live site |
CMSDebugSQLQueriesLive |
If enabled, SQL query debug information is also displayed at the bottom of each live site page. This option requires SQL query debugging to be enabled. |
Debug SQL queries of UI pages |
CMSDebugAllSQLQueries |
If enabled, SQL queries called by pages of the administration interface (CMS Desk and Site Manager) will also be included in the SQL query debug. This option requires SQL query debugging to be enabled. |
Log SQL queries to file |
CMSLogSQLQueries |
If enabled, SQL query debug log is saved into the logsql.log file in the ~\App_Data folder. This option does not require SQL query debugging to be enabled. |
SQL query debug log length |
CMSDebugSQLQueriesLogLength |
Sets the maximum length of the SQL query debug log on the Debug -> SQL queries tab, i.e. the number of requests for which debug information is preserved and displayed on the tab. If empty, value of the Default log length setting (or the CMSDebugEverythingLogLength key) is used. |
Debug SQL connections |
CMSDebugSQLConnections |
If enabled, SQL connection operations (new, open, close) are logged in the SQL query debug log. |
Display stack information |
CMSDebugSQLQueriesStack |
If enabled, stack is tracked when debugging SQL queries and is displayed in the Context column. This information is only available in the debugging UI and on the live site, not in the debug log written into the logsql.log file. |
It may happen that you specify different configuration in the settings and in the web.config file. In such cases, boolean settings (true/false) need to be enabled at least in one place (in web.config or in settings) in order to be enabled, while log lengths specified in Site Manager -> Settings have higher priority than log lengths specified in the web.config.
Here is a list of the keys for easy copy&paste into your web.config:
<add key="CMSDebugSQLQueries" value="true" /> <add key="CMSLogSQLQueries" value="true" /> <add key="CMSDebugSQLQueriesStack" value="true" /> |
SQL query debugging can also be enabled using the general settings and keys.
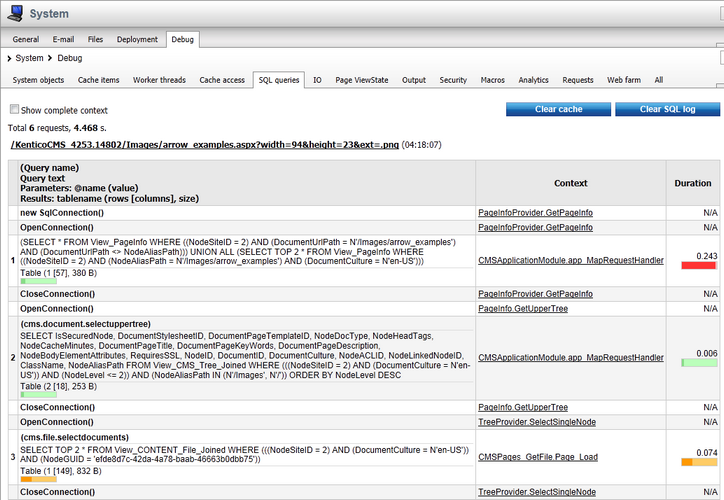
On the Debug -> SQL queries tab, you can see a log of the SQL queries called when particular data is loaded. Each record contains the request used to access the given item and the time when it was loaded. Below it, you can find a table listing all SQL queries executed within the context of the request.
For each query, there are two lines in the table. The first line contains the exact text of the query and the second shows the number of loaded rows, columns in each row and the total size of the loaded data. The Context column shows the context where the query was called from. The last column of the table displays the exact duration of query execution. The last line of the table displays the total volume of data and loading time for all queries under the given request.
Enabling the Show complete context check-box displays complete context (not only the topmost item) in the Context column. Clicking the Clear SQL log button clears all records in this debug log.