|
Security debug |

|

|

|

|
|
Security debug |
|
|
|
|
Security debugging can be turned on by adding one or more of the following keys into the AppSettings section of your web.config file:
| • | <add key="CMSDebugSecurity" value="true"/> - enables the Security tab in Site Manager -> Administration -> System -> Debug |
| • | <add key="CMSDebugSecurityLive" value="true"/> - enables security debugging on the live site |
| • | <add key="CMSDebugAllSecurity" value="true"/> - enables security debugging for all operations (including the UI) |
| • | <add key="CMSDebugSecurityLogLength" value="10"/> - maximal length of the security debug log (number of preserved records) |
| • | <add key="CMSLogSecurity" value="true"/> - if applied, output debug log will be saved into ~/App_Data/logsecurity.log |
It can also be enabled using the bulk keys.
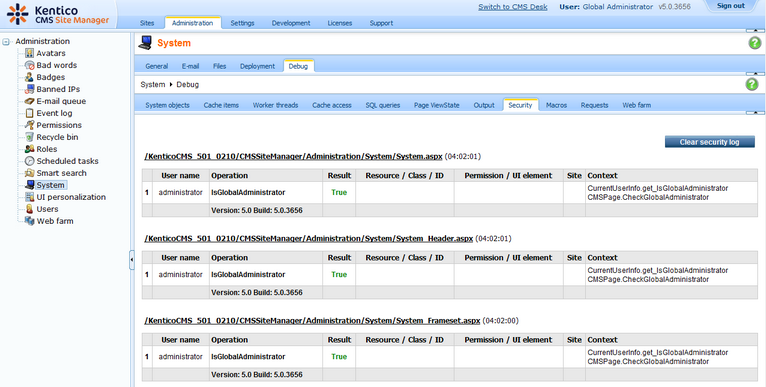
On the Debug -> Security tab, you can see which security checks were recently performed on the site. This is particularly useful if you want to quickly find out why some user is not able to access some section of the UI or gets the Access denied page displayed.
The log can be cleared using the Clear security log button.
Page url: http://devnet.kentico.com/docs/devguide/index.html?security_debugging.htm

