|
|

Performance counters overview |

|

|

|

|
|
Performance counters overview |
|
|

|
|
|
|
Performance counters overview |
|
|
|
|
|
Performance counters overview |
|
|
|
|
|
|
||
This topic provides an overview of default Kentico CMS performance counters, their definition XML file and categories where the counters are stored.
Before getting to the counters, it is important to explain the following key in the appSettings section of the instance's web.config file:
<add key="CMSApplicationName" value="Default Web Site/CMS" /> |
This key is added to the web.config file automatically during installation. In case of IIS installation, path to the instance in IIS is used as its value. In case of Visual Studio web server installation, name of the target web project root folder is used. The value must be less than 60 characters long. In general, the value of the key is used by Kentico CMS Windows services to identify the Kentico CMS instance. Specifically for Health monitoring, the value is used to identify performance counters to which monitored values about the instance should be written.
|
Important!
In case of Visual Studio web server installation, it is possible that multiple instances running on a single server may have identical values of the key (if the instances are installed into folders with the same names). In this case, you need to ensure that the keys have different values. Otherwise, values from these instances may be written to the same counters.
|
Kentico CMS performance counters are stored in two categories:
•Kentico - General (<CMSApplicationName>) - contains general counters monitoring the Kentico CMS instance as a whole. It contains single‑instance counters, which means each of the counters can be added to the to the list of monitored counters just once. If a counter is present in this category as well as in the Sites category, its value in this category is a sum of values of all site instances of the counter in the Sites category.
•Kentico - Sites (<CMSApplicationName>) - contains site specific counters monitoring particular websites running in the Kentico CMS instance. It contains multi‑instance counters, i.e. each of the counters can be added to the list of monitored counters multiple times — once for each website running in the instance. These counters are used only if the Enable site counters option is enabled in Site Manager -> Settings -> System -> Health monitoring.
The <CMSApplicationName> part of the category names is the value of the CMSApplicationName web.config key explained above. In case of IIS installation, the value is reversed in the category names so that website name is stated first and the IIS path after it. For example, if the IIS path is Default Web Site/CMS, you would have CMS/Default Web Site in the name of the category. This should provide better orientation in the category list in Performance Monitor.
In ~\AppData\CMSModules\HealthMonitoring, you can find the counters.xpc file. This is a file in XML format which contains definitions of default performance counters for the respective instance of Kentico CMS. It contains definitions of both General and Site counters. When performance counters are registered in Windows, this file is accessed to get the list of counters to be registered.
Apart from this default file, the whole folder structure under ~\AppData\CMSModules\ is also searched for other files with the .xpc extension when counters are registered. The other files can contain definitions of additional performance counters and when found, the counters are registered as well.
The following code is an extract from the counters.xpc file:
<?xml version="1.0" encoding="utf-8"?> <Counters> <Counter Key="allocatedmemory" Name="Allocated memory in MB" Description="The size of allocated memory in megabytes." Type="NumberOfItems32" Enabled="True" OnlyGlobal="True" /> <Counter Key="pendingrequestspersecond" Name="Pending requests/sec" Description="The number of pending requests per second." Type="NumberOfItems32" Enabled="True" OnlyGlobal="True" PerSecond="True" /> ... </Counters> |
As you can see in the code extract above, each counter element has the following attributes:
•Key – counter key used for its identification.
•Name – name of the counter displayed in Performance Monitor or another monitoring tool.
•Type – type of the counter, all types are listed and explained at: http://msdn.microsoft.com/en-us/library/system.diagnostics.performancecountertype.aspx.
•Enabled – indicates if the counter should be enabled.
•OnlyGlobal – indicates if the counter will be included in the General category (true) or in both General and Sites categories (false).
The following table lists the default counters that are pre-defined in the counters.xpc file and registered in Windows by default:
Counter name |
Category |
Description |
Values written by |
Allocated memory in MB |
Global |
The size of memory allocated by the application in Megabytes. |
Application |
Cache expired items/sec |
Global |
The number of expired cache items per second. |
Application |
Cache removed items/sec |
Global |
The number of items removed from cache per second. |
Application |
Cache underused items/sec |
Global |
The number of underused cache items per second. |
Application |
Content page views/sec |
Global and Sites |
The number of content pages viewed per second. |
Application |
E-mails in queue |
Global and Sites |
The number of e-mails in E-mail queue. |
Application or Windows service1 |
Error e-mails in queue |
Global and Sites |
The number of e-mails in E-mail queue whose sending failed. |
Application or Windows service1 |
Errors |
Global |
The number of errors in event log since last application restart. |
Application |
File downloads/sec |
Global and Sites |
The number of files downloaded per second. |
Application |
Non-page requests/sec |
Global |
The number of non-page requests per second. |
Application |
On-line users – total |
Global and Sites |
The total number of on-line users. |
Application |
On-line users – authenticated |
Global and Sites |
The number of authenticated on-line users. |
Application |
On-line users – anonymous |
Global and Sites |
The number of anonymous on-line users. |
Application |
Pages not found/sec |
Global and Sites |
The number of not found pages (404 error) per second. |
Application |
Pending requests/sec |
Global |
The number of pending page requests per second. |
Application |
Robots.txt views/sec |
Global and Sites |
The number of robots.txt page requests per second.
Important: For values to be written to this counter, IIS must be configured to handle .txt extensions. This can be ensured by following a part of the procedure used when configuring custom URL extensions. The procedure is different for IIS 6 (perform all steps on the page) and for IIS 7 or higher (perform only step 1 of Required configuration). |
Application |
Running SQL queries |
Global |
The number of running SQL queries. |
Application |
Running threads |
Global |
The number of running threads. |
Application |
Scheduled tasks running |
Global |
The number of running scheduled tasks. |
Application |
Scheduled tasks in queue |
Global |
The number of scheduled tasks in queue. |
Application or Windows service1 |
System page views/sec |
Global |
The number of system pages viewed per second. |
Application |
Warnings |
Global |
The number of warnings in event log since last application restart. |
Application |
1 The Windows service is used to write values to these counters only if it is installed and if the Use external service option is enabled in Site Manager -> Settings -> System -> Health monitoring. |
|||
It is also possible to define custom counters to monitor other system values according to your specific needs. For more information on this, please refer to the Adding custom counters topic.
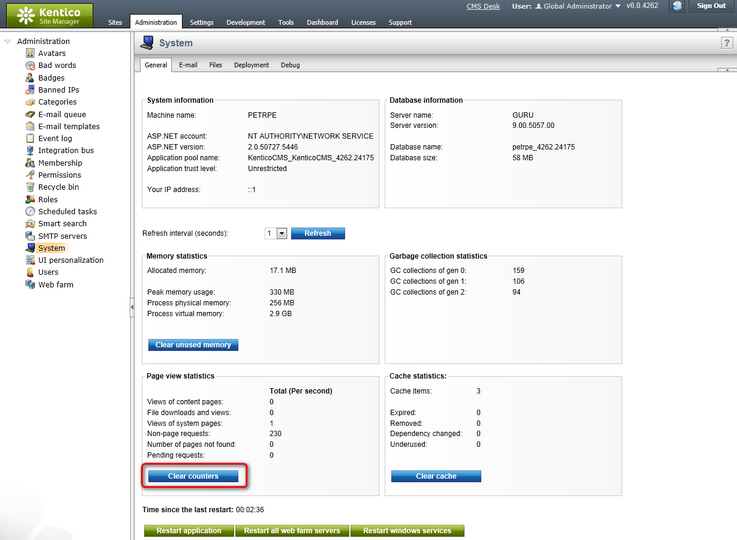
By clicking the Clear counters button in Site Manager -> Administration -> System, it is possible to clear values stored in all counters registered for the current Kentico CMS instance. Due to the fact that Health monitoring is only functional in Full Trust environment, the button is only present in this section if the application is running in Full Trust environment.