|
|

Analytics |

|

|

|

|
|
Analytics |
|
|

|
|
|
|
Analytics |
|
|
|
|
|
Analytics |
|
|
|
|
|
|
||
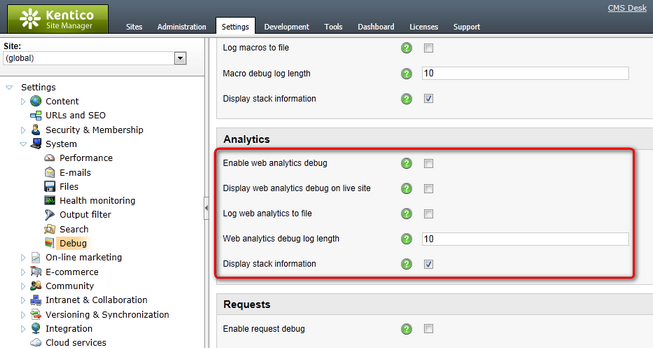
Web analytics debugging can be turned on and configured either by adjusting certain settings in Site Manager -> Settings -> System -> Debug, or by adding certain keys into the AppSettings section of your web.config file. The following table lists and explains these settings and keys:
Setting |
Web.config key |
Description |
Enable web analytics debug |
CMSDebugAnalytics |
Enables web analytics debugging and the Analytics tab in Site Manager -> Administration -> System -> Debug. |
Display web analytics debug on live site |
CMSDebugAnalyticsLive |
If enabled, web analytics debug information is also displayed at the bottom of each live site page. This option requires web analytics debugging to be enabled. |
Log web analytics to file |
CMSLogAnalytics |
If enabled, web analytics debug log is saved into the loganalytics.log file in the ~\App_Data folder. This option does not require web analytics debugging to be enabled. |
Web analytics debug log length |
CMSDebugAnalyticsLogLength |
Sets the maximum length of the web analytics debug log on the Debug -> Analytics tab, i.e. the number of requests for which debug information is preserved and displayed on the tab. If empty, value of the Default log length setting (or the CMSDebugEverythingLogLength key) is used. |
Display stack information |
CMSDebugAnalyticsStack |
If enabled, stack is tracked when debugging web analytics and is displayed in the Context column. This information is only available in the debugging UI and on the live site, not in the debug log written into the loganalytics.log file. |
It may happen that you specify different configuration in the settings and in the web.config file. In such cases, boolean settings (true/false) need to be enabled at least in one place (in web.config or in settings) in order to be enabled, while log lengths specified in Site Manager -> Settings have higher priority than log lengths specified in the web.config.
Here is a list of the keys for easy copy&paste into your web.config:
<add key="CMSDebugAnalytics" value="true" /> <add key="CMSLogAnalytics" value="true" /> <add key="CMSDebugAnalyticsStack" value="true" /> |
IO operation debugging can also be enabled using the general settings and keys.
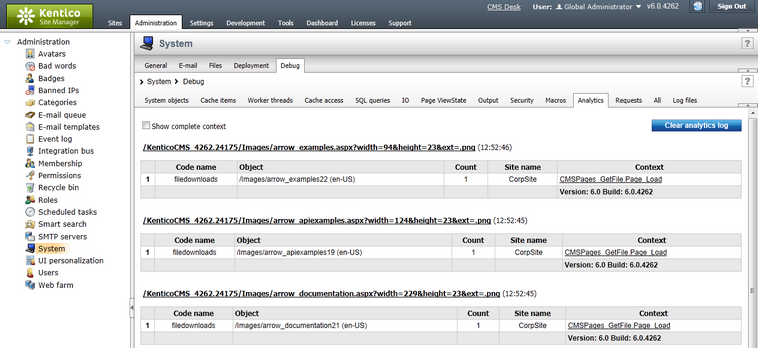
On the Analytics tab, you can see which statistics were logged by the Web analytics module for individual requests. For each logged item, you can see the code name of the logged operation, the object to which the operation relates, number of the performed operations and the name of the site where the operation was performed. In the Context column, you can see the context from which the operation was logged.
Enabling the Show complete context check-box displays complete context (not only the topmost item) in the Context column. The log can be cleared using the Clear analytics log button.