|
|

Request |

|

|

|

|
|
Request |
|
|

|
|
|
|
Request |
|
|
|
|
|
Request |
|
|
|
|
|
|
||
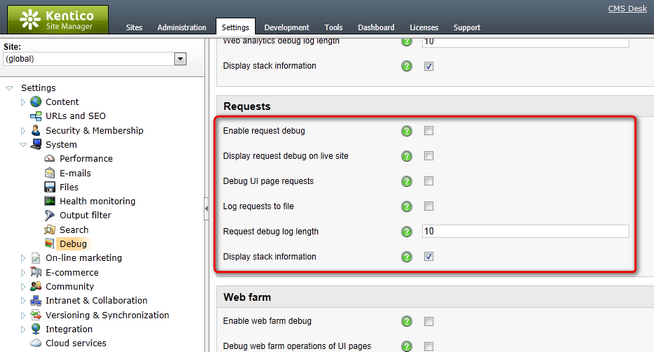
Request debugging can be turned on and configured either by adjusting certain settings in Site Manager -> Settings -> System -> Debug, or by adding certain keys into the AppSettings section of your web.config file. The following table lists and explains these settings and keys:
Setting |
Web.config key |
Description |
Enable request debug |
CMSDebugRequests |
Enables request debugging and the Requests tab in Site Manager -> Administration -> System -> Debug. |
Display request debug on live site |
CMSDebugRequestsLive |
If enabled, request debug information is also displayed at the bottom of each live site page. This option requires request debugging to be enabled. |
Debug UI page requests |
CMSDebugAllRequests |
If enabled, administration interface (CMS Desk and Site Manager) page requests will also be included in the macro debug. This option requires request debugging to be enabled. |
Log requests to file |
CMSLogRequests |
If enabled, request debug log is saved into the logRequests.log and logRequestsUrls.log files in the ~\App_Data folder. The first file contains the full log, while the second one only lists requested URLs. This option does not require request debugging to be enabled. |
Request debug log length |
CMSDebugRequestsLogLength |
Sets the maximum length of the request debug log on the Debug -> Requests tab, i.e. the number of requests for which debug information is preserved and displayed on the tab. If empty, value of the Default log length setting (or the CMSDebugEverythingLogLength key) is used. |
Display stack information |
CMSDebugRequestsStack |
If enabled, stack is tracked when debugging requests and is displayed in the Context column. This information is only available in the debugging UI and on the live site, not in the debug log written into the logRequests.log file. |
It may happen that you specify different configuration in the settings and in the web.config file. In such cases, boolean settings (true/false) need to be enabled at least in one place (in web.config or in settings) in order to be enabled, while log lengths specified in Site Manager -> Settings have higher priority than log lengths specified in the web.config.
Here is a list of the keys for easy copy&paste into your web.config:
<add key="CMSDebugRequests" value="true" /> <add key="CMSLogRequests" value="true" /> |
Request debugging can also be enabled using the general settings and keys.
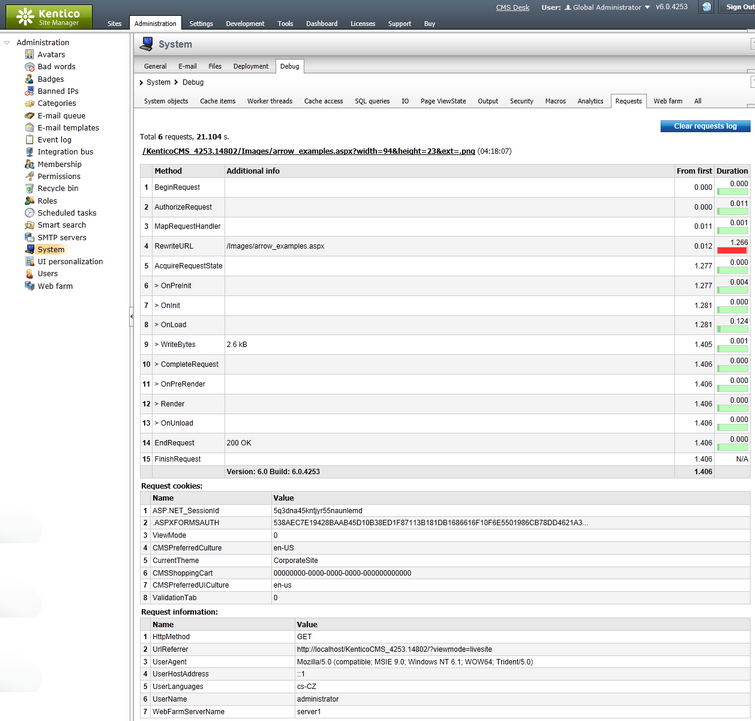
On the Debug -> Requests tab, you can see the time each of the recent page requests took to process. You not only see the overall time, but also separate times of particular parts of each requests, along with other detailed information about the request.
This is particularly useful if your response time is too large and you need to figure out why. You can basically see whether the issue is outside the application or inside it by comparing the real response time and response time spent in the application, what data came with the request and from which context.
Enabling the Show complete context check-box displays complete context (not only the topmost item) in the Context column. The log can be cleared using the Clear request log button.