|
|

Displaying reports on the website |

|

|

|

|
|
Displaying reports on the website |
|
|

|
|
|
|
Displaying reports on the website |
|
|
|
|
|
Displaying reports on the website |
|
|
|
|
|
|
||
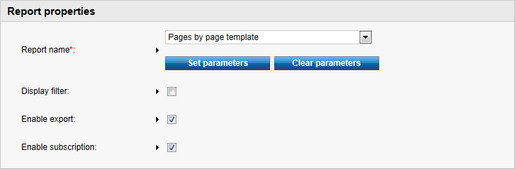
If you want to display a report on the website or include it on a custom page in the CMS administration interface, you can use the Reporting -> Report web part. All you need to configure are the following properties:
•Report name - select the required report.
•Display filter - indicates if a parameter filter should be displayed on the page (if the report has some parameters specified).
•Enable export - if enabled, users will be able to export the data displayed in the report's charts and tables to other formats (Excel, CSV or XML). The export feature may be accessed using a context menu that can be opened by right clicking the rendered chart/table. Please note that data export will not be allowed if it is disabled for the given chart/table using the properties in the main reporting interface.
•Enable subscription - indicates whether authenticated users should be allowed to subscribe to the components (graphs, tables or values) in the displayed report. Subscription can be done by right clicking on the appropriate item and selecting the Subscribe to option in the context menu. In addition to this property, subscription also needs to be enabled for the given report and the specific graph, table or value in the main reporting interface. Please see the Report subscriptions topic for more information.
If the selected report has some parameters defined, their values can be entered here by using the Set parameters button. However, if the Display filter property is enabled, these settings will be ignored, as the parameters will be be configurable on the live site using the filter.
If you only wish to display a certain graph, table or value from the report, this can be done by using one of the other web parts from the Reporting category:
•Report chart
•Report table
•Report value
The exact chart/table/value must be specified in the respective property of the web part.
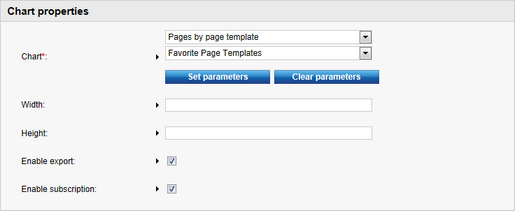
The first drop‑down list is used to select the report, the second one specifies the chart, table or value. Values of the report's parameters can be specified using the Set parameters button.
These web parts are also available as Widgets.
Example
1. To display this report on your website, switch to the Content tab of CMS Desk. Select the root of your website and create a new Page (menu item) type document. Name it Reports, choose the Create a blank page option and click Save.
2. Now add the Reporting/Report web part to the page's web part zone on the Design tab and set its properties to the following:
•Report name - select Pages by page template
•Display filter - enabled
3. Now go to Live site mode and you should see something similar to the following:
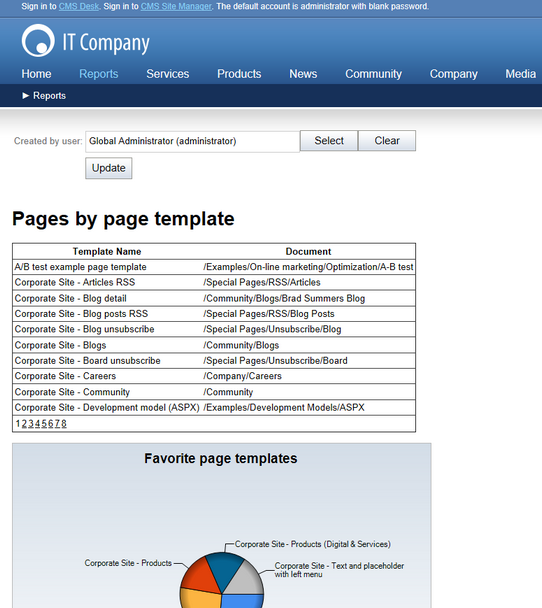
As you can see, the report is displayed just like on the View tab of the Report Properties dialog and the parameter filter can be used by site visitors.