Evaluating campaigns |

|

|

|

|
|
Evaluating campaigns |

|

|

|

|
|
|
||
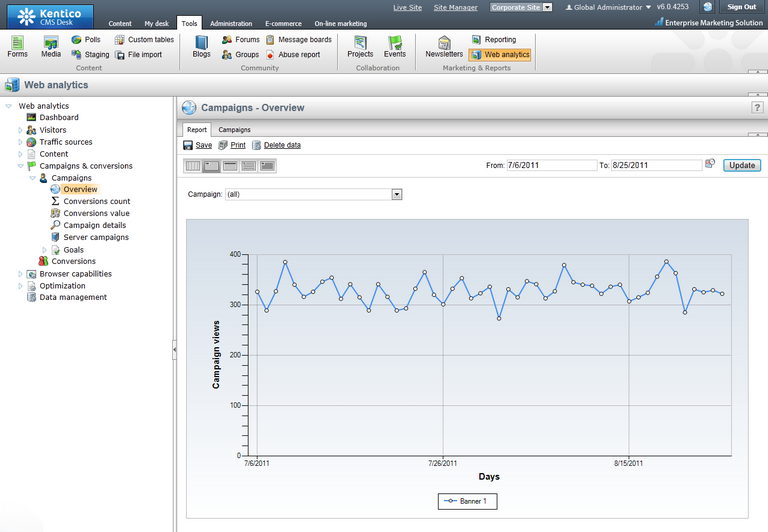
The statistics logged for campaigns may be viewed using various types of web analytics reports. To access these reports, go to CMS Desk -> Tools -> Web analytics and expand the Campaigns & conversions -> Campaigns category.

Campaign reports use the same basic format as other web analytics reports, so please see the Web analytics reports topic for information about the actions that can be used to specify which data should be displayed. The following types of reports are available for campaigns:
Overview |
Displays the amount of hits that the website received as a result of the selected campaign(s). It contains a line chart that shows the number of visits recorded over time and a table with the total amount of page views generated by the given campaigns during the entire time period. |
Conversions count |
Displays the number of conversion hits that were performed by users who arrived on the website through the selected campaign.
This report includes two types of charts, one that shows the progress of the amount of conversion hits recorded during the specified time period and another with detailed statistics for individual units of time according to the selected report type (hours, days, months etc.). |
Conversions value |
Displays the sum of the conversion values generated by users who arrived on the website through the selected campaign.
This report includes two types of charts, one that shows the progress of the conversion values recorded during the specified time period and another with detailed statistics for individual units of time according to the selected report type. |
Campaign details |
Displays the values of the following campaign metrics:
•Visits - the amount of hits that the website received as a result of the given campaign. •Conversions - the number of conversions that were performed by users who arrived on the site through the campaign. •Conversions rate - the percentage of visitors that performed a conversion. This can be higher than 100% if the average visitor generated more than one conversion. •Conversions value - the total sum of the values recorded for all of the campaign's conversions. •Conversions value per visit - the average conversion value contributed by the campaign's visitors. •Total cost - shows the total cost that was specified for the given campaign. •ROI - the rate of investment, calculated as the sum of the campaign's conversion values divided by the total cost. This statistic is accurate only if your conversion values are set to reflect the income generated by the matching conversions.
You can either choose to view all campaigns defined for the website and compare their values, or select a specific campaign and analyze the statistics logged for individual types of conversions. |
Server campaigns |
May be used to compare the results of campaigns created for different sites in the system. You can choose to display the Views, Conversion count or Conversion value statistics for the campaigns belonging under the selected site. |
In addition to the data provided by the reports listed above, you can optionally specify goals that should be achieved by each campaign and then compare them with the actual results.
To enter a campaign's goals, select any of the reports, switch to the Campaigns tab, and edit (![]() ) the given campaign. On the General tab, the following two properties are available among the advanced settings:
) the given campaign. On the General tab, the following two properties are available among the advanced settings:
•Campaign impressions - this field can be used to specify how many people were targeted by the given marketing campaign. For example, if you sent marketing e‑mails containing a link to the website to ten thousand people, the amount of impressions would be 10000.
•Total cost - allows you to manually enter the total cost of the given marketing campaign. This can be used to determine whether the campaign was a success and when calculating the campaign's goals.
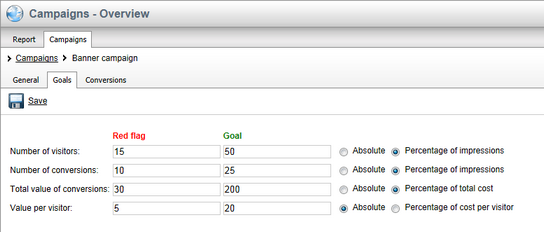
Now switch to the Goals tab, where you can configure the following types of target values for the campaign:
•Number of visitors - sets how many visitors should be brought to the website by the campaign. It can either be specified directly as an Absolute number, or as a percentage of the campaign's Impressions according to the value set on the General tab.
•Number of conversions - specifies the expected amount of conversions performed by users who visit the website as a result of the campaign. It can either be specified directly as an Absolute number, or as a percentage of the campaign's Impressions.
•Total value of conversions - sets a target number for the sum of all conversion values logged as a result of the campaign. It can either be specified directly as an Absolute number, or as a percentage of the campaign's Total cost.
•Value per visitor - this indicator allows you to specify the average conversion value that should be generated by a single campaign visitor. It is calculated as the campaign's Total value of conversions divided by its Number of visitors. The value can either be specified directly as an Absolute number, or as a percentage of the campaign's Cost per visitor (i.e. the Total cost divided by the Number of Visitors).

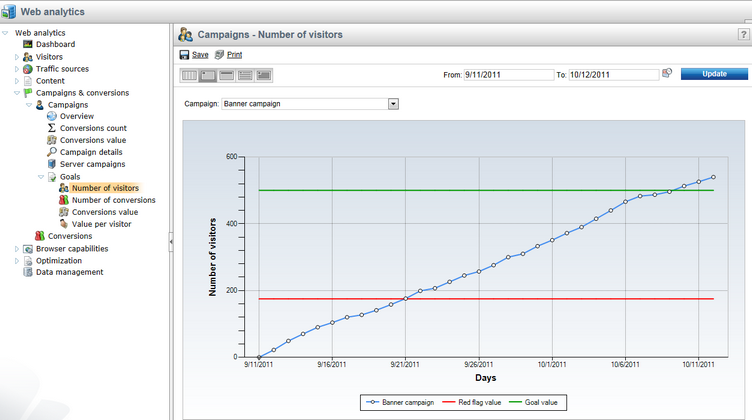
Each goal may have two values. The Red flag may be used to set a number that must be reached in order for the campaign to be at least partially successful (campaigns below this value are considered to have failed). The Goal value sets a target that should ideally be achieved by the campaign. The progress that individual campaigns make towards their goals can then be followed using the corresponding reports under the Goals sub‑category in the web analytics tree.

The red flag and goal values configured for the selected statistic are displayed in the reports as red and green lines, so you can easily see the current status of the specified campaign.
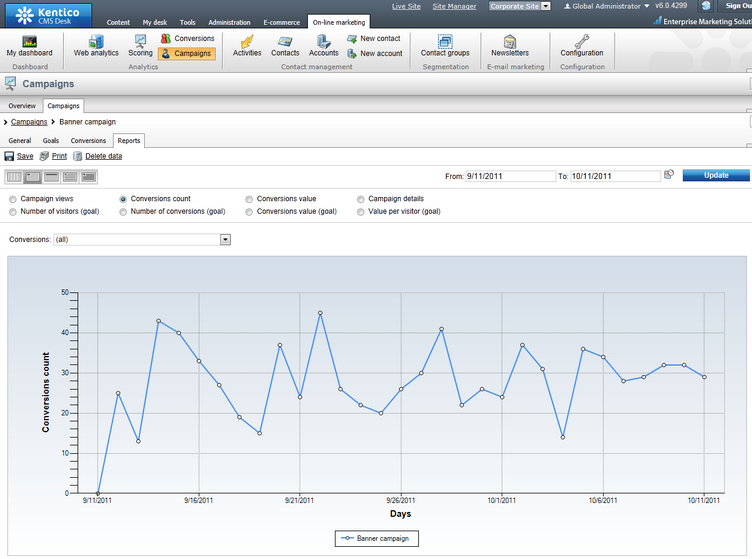
Any of the reports described above may also be viewed when editing a campaign in CMS Desk -> On‑line marketing -> Campaigns on the Reports tab. You can choose a specific report via the radio buttons at the top of the page.

Only the data logged for the given campaign is displayed here.