|
Web farm debugging |

|

|

|

|
|
Web farm debugging |
|
|
|
|
Web farm debugging can be turned on by adding one or more of the following keys into the AppSettings section of your web.config file:
| • | CMSDebugWebFarm - enables the Web farm tab in Site Manager -> Administration -> System -> Debug |
| • | CMSDebugAllWebFarm - enables web farm debugging for all operations (including the UI) |
| • | CMSDebugWebFarmLive - enables web farm debugging on the live site |
| • | CMSDebugWebFarmLogLength - maximal length of the web farm debug log (number of preserved records) |
Here is a list of these keys for easy copy&paste into your web.config:
<add key="CMSDebugWebFarm" value="true" /> <add key="CMSDebugAllWebFarm" value="true" /> <add key="CMSDebugWebFarmLive" value="true" /> <add key="CMSDebugWebFarmLogLength" value="20" /> |
Web farm debugging can also be enabled using the bulk keys.
User interface
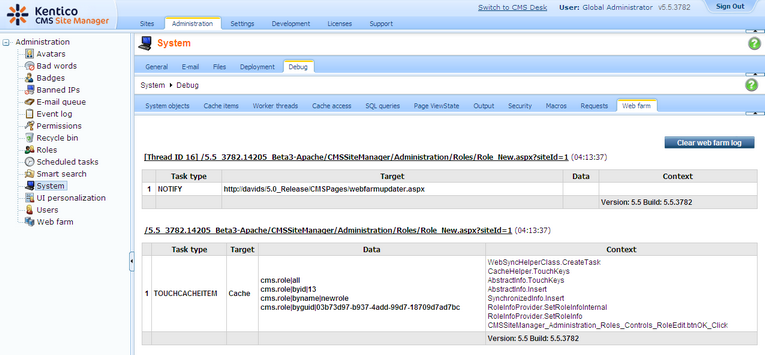
On the Debug -> Web farm tab, you can see which web farm tasks were logged and which servers were notified about the changes. This is particularly useful if you want to find out if the web farm works effectively and synchronizes correct data, or generally if you want to troubleshoot web-farm-related issues.
The following screenshot shows how the debug looks on the source server (the server where the data was modified). The bottom part show the logged tasks, while the top part shows asynchronous notifications of other web farm servers.
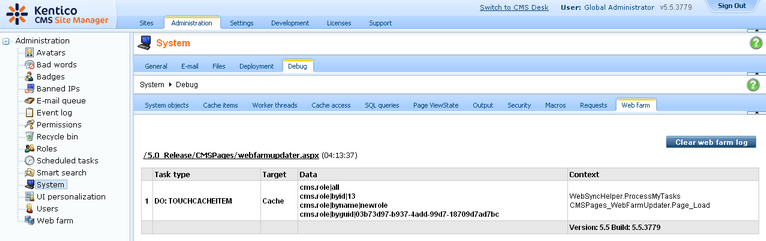
The second screenshot shows how the debug looks on the target server after it is notified about the modification. You can recognize the task by the DO: prefix, which indicates that the synchronization task was (is being) processed.
The log can be cleared using the Clear web farm log button.
Page url: http://devnet.kentico.com/docs/5_5r2/devguide/index.html?web_farm_debugging.htm

