|
Request debug |

|

|

|

|
|
Request debug |
|
|
|
|
Request debugging can be turned on by adding one or more of the following keys into the AppSettings section of your web.config file:
| • | CMSDebugRequests - enables the Request tab in Site Manager -> Administration -> System -> Debug |
| • | CMSDebugRequestsLive - enables request debugging on the live site |
| • | CMSDebugAllRequests - enables request debugging for all pages (including the UI) |
| • | CMSDebugRequestsLogLength - if applied, output debug log will be saved into ~/App_Data/logrequests.log |
Here is a list of these keys for easy copy&paste into your web.config:
<add key="CMSDebugRequests" value="true" /> <add key="CMSDebugRequestsLive" value="true" /> <add key="CMSDebugAllRequests" value="true" /> <add key="CMSDebugRequestsLogLength" value="10" /> |
Request debugging can also be enabled using the bulk keys.
User interface
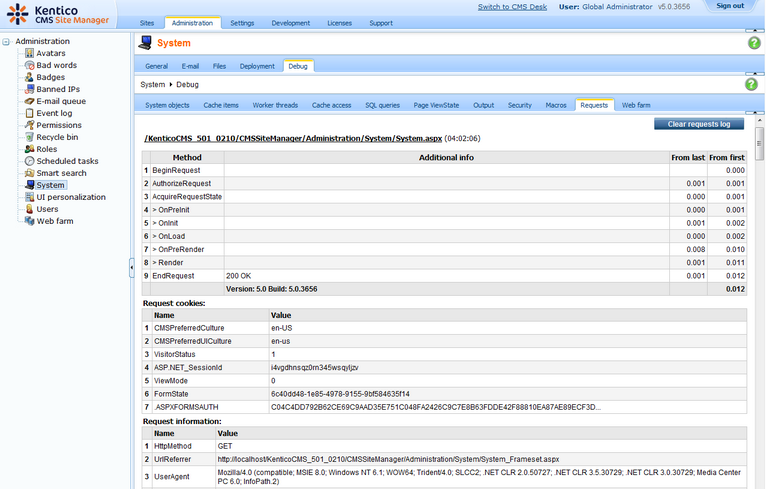
On the Debug -> Requests tab, you can see the time each of the recent page requests took to process. You not only see the overall time, but also separate times of particular parts of each requests, along with other detailed information about the request.
This is particularly useful if your response time is too large and you need to figure out why. You can basically see whether the issue is outside the application or inside it by comparing the real response time and response time spent in the application, what data came with the request and from which context.
The log can be cleared using the Clear request log button.
Page url: http://devnet.kentico.com/docs/5_5r2/devguide/index.html?request_debugging.htm

