|
Overview |

|

|

|

|
|
Overview |
|
|
|
|
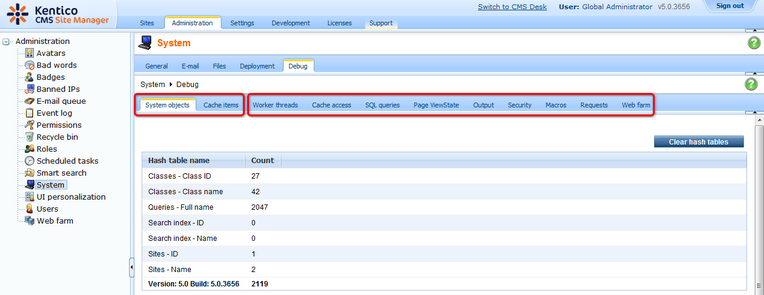
Debugging in the UI
The Administration -> System -> Debug tab can be used for system debugging, i.e. finding and fixing performance or settings issues on your website. Debugs are also particularly useful in case that you are reporting an issue to our support department. Every extra bit of information related to your issue that you find in the debugs can significantly shorten the time needed to solve the issue.
The debugging interface is divided into several sub-tabs. Only the following two tabs are displayed by default. Click the name of the tab to learn more.
The other sub-tabs are displayed only after adding a dedicated key into the AppSettings section of your web.config file. Here again, click the name of the tab to get detailed information.
You can enable all these debugs at once using the bulk keys.
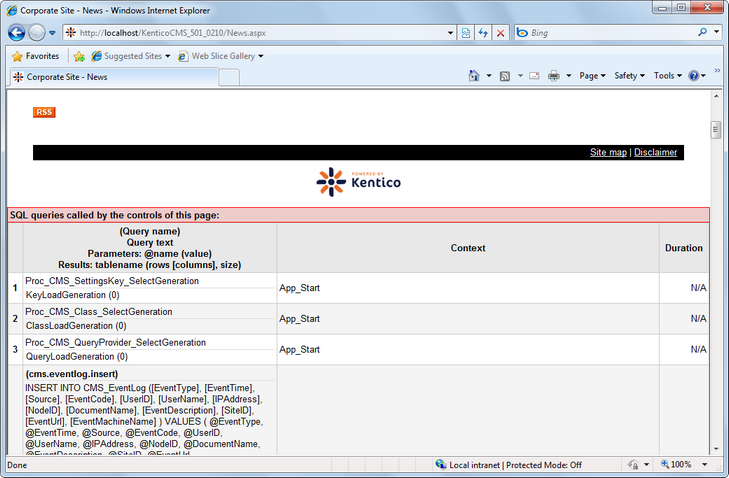
Debugging on the live site
You can also enable debugging directly on the live site. In this case, the debug log is displayed at the bottom of each loaded page. Like UI debugs, live site debugging too can be enabled either separately using the dedicated keys (follow the links above) or all at once using the bulk keys.
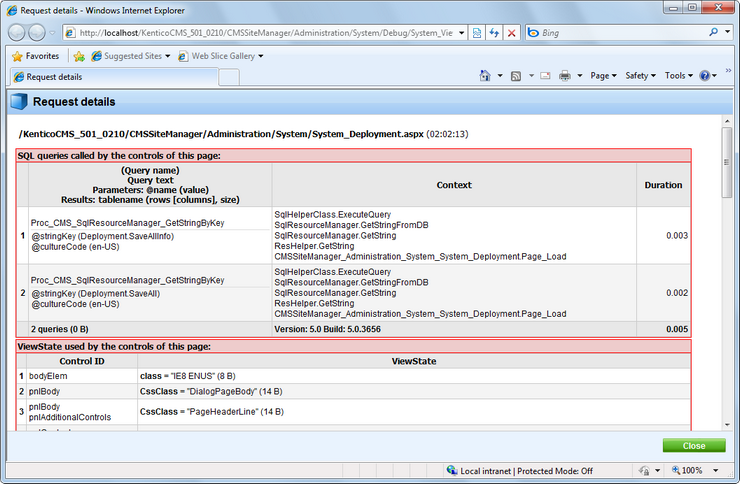
Request details
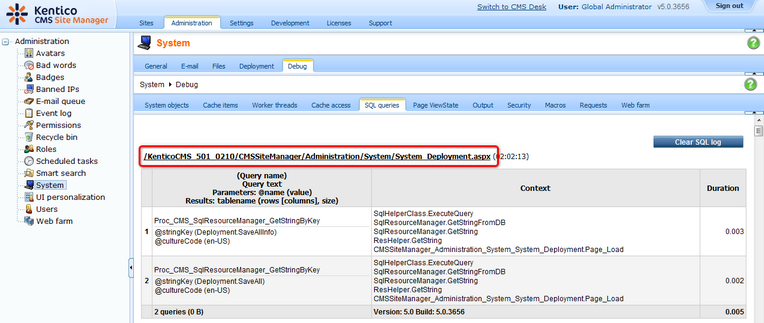
You can display request details for each debugged request by clicking its URL in any debug log either in the UI or on the live site.
After doing so, a new pop-up window gets opened, listing the request's debug log for all enabled debugs.
Page url: http://devnet.kentico.com/docs/5_5r2/devguide/index.html?debugging_overview.htm

