|
SQL queries debug |

|

|

|

|
SQL queries debugging can be turned on by adding one or more of the following keys to the web.config file of your web project:
| • | <add key="CMSDebugSQLQueries" value="true" /> - enables the SQL queries tab in Site Manager -> Administration -> System -> Debug |
| • | <add key="CMSDebugSQLQueriesLive" value="true" /> - enables SQL queries debugging on the live site |
| • | <add key="CMSDebugAllSQLQueries" value="true" /> - enables debugging of all SQL queries (including the UI) |
| • | <add key="CMSDebugSQLQueriesLogLength" value="10" /> - maximal length of the SQL queries debug log (number of preserved records) |
| • | <add key="CMSLogSQLQueries" value="true" /> - if applied, SQL queries debug log will be saved into ~/App_Data/logsql.log |
It can also be enabled using the bulk keys.
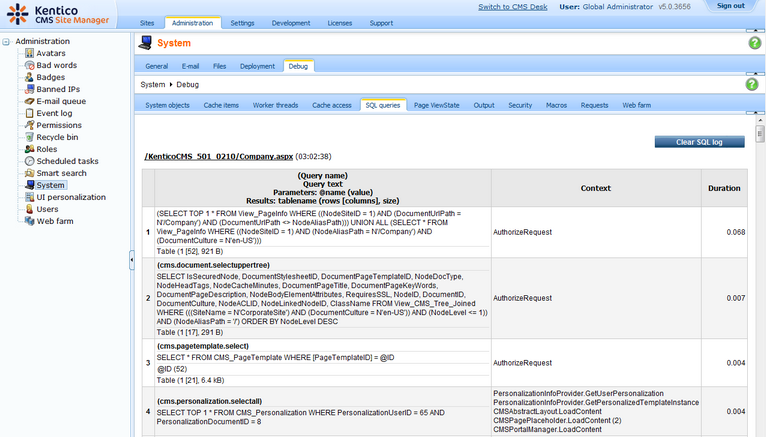
On the Debug -> SQL queries tab, you can see a log of SQL queries called on loading of particular pages. For each record, there is row with a URL of the loaded page followed by its time of display. Below it, you can find a table listing all SQL queries executed when loading the page.
For each query, there are two lines in the table. The first line contains the exact text of the query, while the second line contains the number of loaded rows, columns in each row and the size of the loaded data. The Context column shows where the query was called from. The last column of the table displays the exact duration of query execution. The last line of the table displays the overall page loading time.
Clicking the Clear SQL log button clears all records in this debug log.

Page url: http://devnet.kentico.com/docs/devguide/index.html?sql_queries_debugging.htm