|
Debugging |

|

|

|

|
|
Debugging |
|
|
|
|
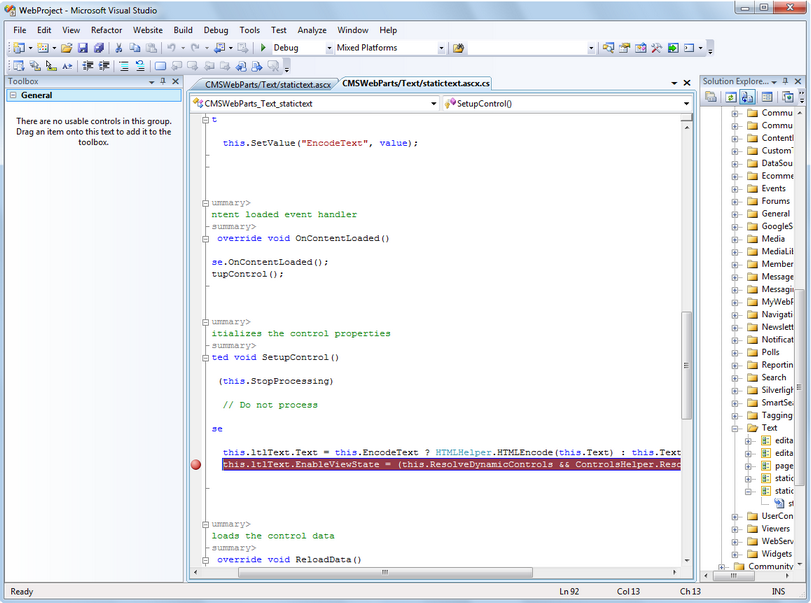
If you're adding custom code using Visual Studio into Kentico CMS, you can easily debug it in Visual Studio as you're used to since Kentico CMS is a standard Visual Studio application. Simply click on the left next to your method or command and it will create a red breakpoint:
Now choose Debug -> Start debugging in the main menu or press F5. The web site starts and you can track the code flow. You may get a message like this:
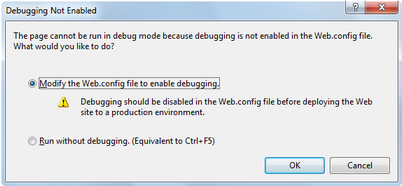
You will need to choose to Modify the web.config file to enable debugging and click OK. It's recommended that you disable debugging before deploying the web site to a production environment by setting the value
<compilation debug="true" .... />
to false in your web.config file for better performance.
Debugging using IIS web site
The debug mode starts in built-in web server by default. You can change this in the Web site -> Start options dialog by choosing the Use custom server option like this:
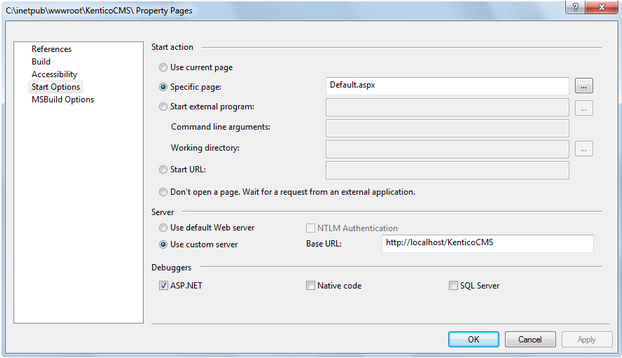
Please note that you need to be local administration and the web site or virtual directory must be configured for both anonymous and Windows authentication (see Creating a virtual directory for details).
Page url: http://devnet.kentico.com/docs/devguide/index.html?debugging.htm

