|
|

Adding custom analytics |

|

|

|

|
|
Adding custom analytics |
|
|

|
|
|
|
Adding custom analytics |
|
|
|
|
|
Adding custom analytics |
|
|
|
|
|
|
||
This example describes in detail how you can track custom events using web analytics, measure them as statistics and display the results in reports. A simple button click event will be logged for this purpose, but you may use the same basic approach to implement tracking of any type of events on your website.
1. In this example, the event will be logged through a user control. Open your Kentico CMS web project in Visual Studio and create a New folder under the root named according to the code name of your site, e.g. CorporateSite (if it doesn't already exist). Right‑click the folder and select Add New Item. Choose to create a Web User Control and name it AnalyticsButton.ascx. This location ensures that the control will be exported along with your website if it is deployed to a different server.
2. Add the following code to the control:
<asp:Button id="btnLog" runat="server" Text="Add analytics hit" onclick="btnLog_Click" /> |
This inserts a simple Button control which will be used to add hits to the custom statistic.
3. Switch to the code behind file of the control and modify it according to the following. Please keep in mind that the name of the class will be different according to the code name of your site.
[C#]
using CMS.WebAnalytics; // Adds a hit to a custom statistic HitLogProvider.LogHit("buttonclicked", CMSContext.CurrentSiteName, null, CMSContext.CurrentUser.UserName, 0); } |
As shown above, custom events for web analytics can be logged via the API using the HitLogProvider class from the CMS.WebAnalytics namespace, specifically the following method:
LogHit(string codeName, string siteName, string culture, string objectName, int objectId, int count, double value)
•codeName - determines the code name of the custom statistic, buttonclicked in the case of this example. This name is also used in the code names of related reports.
•siteName - specifies the code name of the site for which the event should be logged.
•culture - specifies the culture code under which the event should be logged.
•objectName / objectId - used to specify the context in which the hit was logged. It is possible to use a name or ID of an object. For example, when logging page views, the alias path and document ID of the given page would be stored. In the current scenario, the name of the user who clicked the button is logged as the related object.
•count - sets the amount of hits that should be added to the statistic. This parameter is optional and the default value (1) is used if it is not specified.
•value - specifies a special value for the hit. This parameter is optional and can be used to assign weight to the hit according to some conditions. The value of a statistic is cumulative, which means that each hit adds to the total value logged for the given analytics record (specified by the objectName and objectId).
When a user clicks the button, a log will be created and processed. The results containing the given user's name and the amount of clicks will be stored in the database, where they can be used by the web analytics module.
Save all changes to the user control's files.
4. Next, it is necessary to publish this user control on your website (this example will use the sample Corporate site). Go to CMS Desk -> Content -> Edit, select the Home document from the content tree, switch to the Design tab and add (![]() ) a web part to the zoneCenter zone. Select the General -> User control from the web part catalog and enter ~/CorporateSite/AnalyticsButton.ascx into its User control virtual path property. The button will now be displayed on the page.
) a web part to the zoneCenter zone. Select the General -> User control from the web part catalog and enter ~/CorporateSite/AnalyticsButton.ascx into its User control virtual path property. The button will now be displayed on the page.
There are also other ways to add custom web analytics functionality to the pages of your website. For example, you could implement the control as a custom web part, add it to your pages and configure it as necessary. If you are using the ASPX page template development model for the website, you can of course integrate the code and any required interface elements directly into your page templates.
|
Using the Analytics custom statistics web part
If you wish to log a simple event when visitors access a specific page, you can do so without having to write any code by using the Web analytics -> Analytics custom statistics web part.
Once this web part is placed on a page, it will automatically add a hit to a custom statistic when the given page is viewed. The details of the statistic, such as its code name, the name of the related object or the hit value can be specified using the web part's properties. The site name and culture is automatically taken from the current context of the page. |
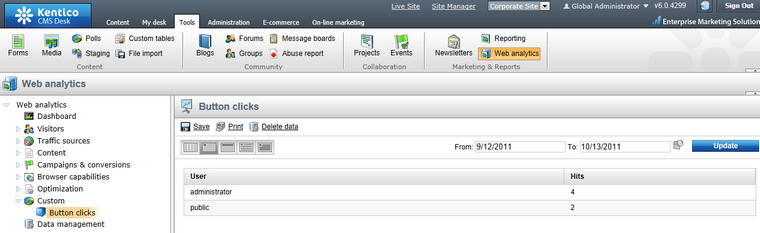
5. View the live site version of the Home page and click the Add analytics log button several times to add hits to the custom statistic. Try doing this while logged in under different user accounts.
Before you can view the statistics of the button click event in CMS Desk -> Tools -> Web Analytics, the reports that will display the data of the statistics have to be created.
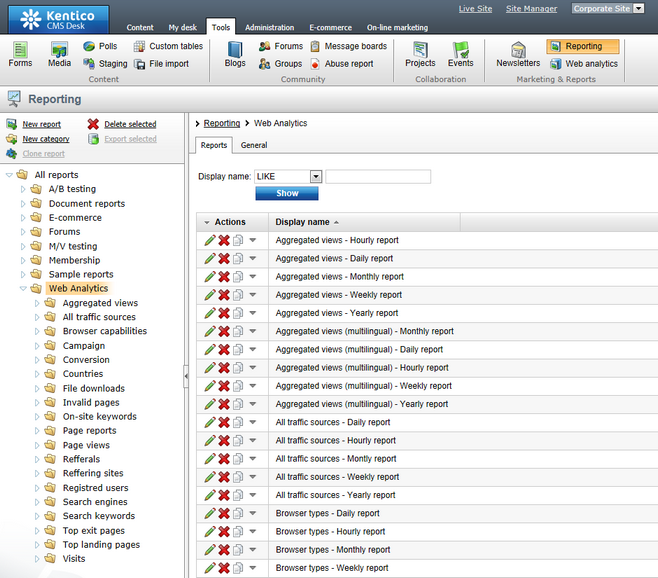
6. Go to CMS Desk -> Tools -> Reporting and expand the Web Analytics category in the tree on the left. There are already quite a few sub‑categories that contain reports used by default statistics such as page views, traffic sources, campaigns, etc. Most statistics have five types of reports: hourly, daily, weekly, monthly and yearly.
The code names of the reports have to use a specific format:
•<statistic code name>.hourreport
•<statistic code name>.dayreport
•<statistic code name>.weekreport
•<statistic code name>.monthreport
•<statistic code name>.yearreport
In our example, the code name of the custom statistic is buttonclicked, as defined above in the code of the user control.
7. Add a ![]() New category under Web Analytics and enter the following names for it:
New category under Web Analytics and enter the following names for it:
•Category display name: Button clicks
•Category code name: ButtonClicks
Click OK.
8. Now we will create a daily report for the new statistic. Click the ![]() New report link and enter the following values:
New report link and enter the following values:
•Report display name: Button clicked - daily report
•Report code name: buttonclicked.dayreport
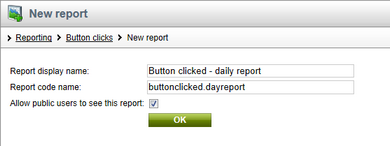
Click OK again.
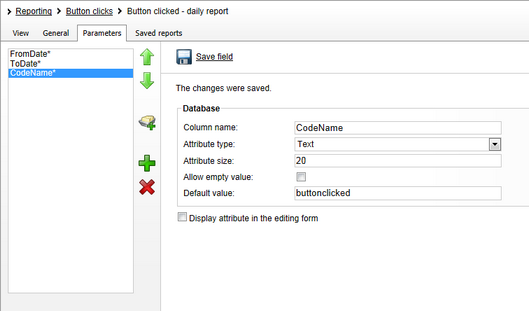
9. Switch to the Parameters tab of the new report and use the New attribute (![]() ) button to create three essential parameters which will be used internally by the web analytics module. Click
) button to create three essential parameters which will be used internally by the web analytics module. Click ![]() Save field for every parameter before moving on to the next one:
Save field for every parameter before moving on to the next one:
•Column name: FromDate
•Attribute type: Date and Time
•Display attribute in the editing form: disabled
•Column name: ToDate
•Attribute type: Date and Time
•Display attribute in the editing form: disabled
The two parameters above define a time interval used to limit which data of the statistic should be loaded. Only hits that occurred during the specified interval will be displayed in the report. The values of these parameters can be set by users when viewing the data of the statistic in the web analytics interface.
•Column name: CodeName
•Attribute type: Text
•Attribute size: 20
•Default value: buttonclicked (the code name of the displayed statistic in general)
•Display attribute in the editing form: disabled
This parameter is simply used to identify from which statistic the data should be loaded. Its value is usually not modified if the report is dedicated to a single statistic (like the one in this example).
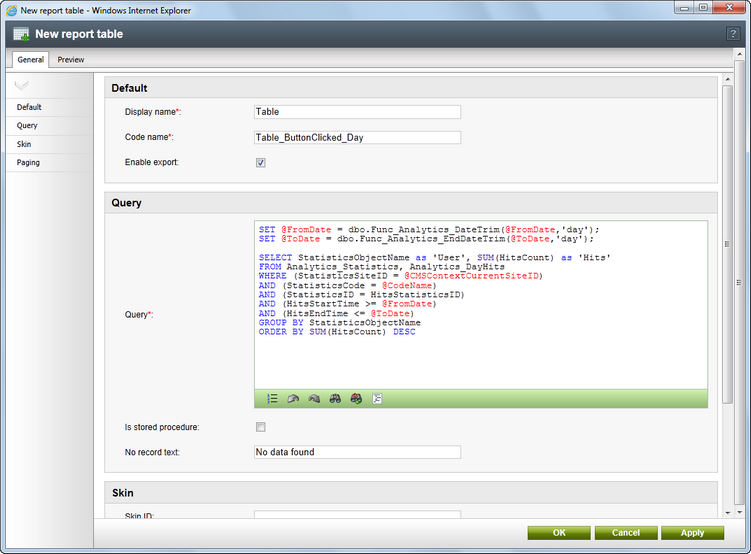
10. Go to the General tab and click the New button in the Tables section below the layout editor to create a report table. Fill in its properties as shown below:
•Display name: Table
•Code name: Table_ButtonClicked_Day
•Enable export: true (checked)
•Query:
SET @FromDate = dbo.Func_Analytics_DateTrim(@FromDate,'day'); |
|
Trimming the values of the FromDate and ToDate parameters
The SET statements included in the query are necessary to ensure that the specified time interval includes the first and last units of time (e.g. the exact days entered entered into the From and To fields of a daily report).
The second parameter of the trimming functions must match the time unit of the given report. The options are: 'hour', 'day', 'week', 'month', 'year'. |
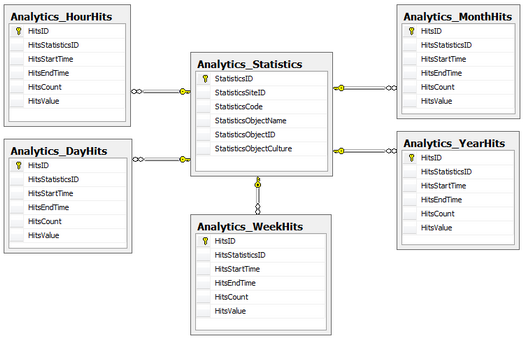
There are six important database tables used by the web analytics module to keep track of statistics and their values. The Analytics_Statistics table stores records that represent the statistics of a tracked event within a certain context, i.e. related to a specific object, site and culture.
Five other tables are used to store the exact number of hits for the statistics in the Analytics_Statistics table (Analytics_HourHits, Analytics_DayHits, Analytics_WeekHits, Analytics_MonthHits and Analytics_YearHits). When a hit for a tracked statistic occurs, it is logged into all of these tables. The difference between them is in the unit of time used to separate hits into individual records. For example, a record in the Analytics_HoursHits table would contain the number of hits that were logged for a given statistic during one hour, while a single record in Analytics_MonthHits would count all hits that occurred over an entire month.
The diagram below represents the basic database structure used to store statistics and their hits:
Since the new report is a daily report, the data of the table is retrieved from the Analytics_DayHits table, together with the Analytics_Statistics table.
Click OK to create the table.
11. To complete the daily report, use the Insert button in the Tables section to add a macro representing the table into the layout of the report and click ![]() Save.
Save.
In a real‑world scenario, the report would usually also contain a graph to display the data. Please refer to the Modules -> Reporting chapter to learn more about graphs and other reporting options.
The reports for the remaining time intervals can be created using the same approach. The only differences should be in the names of the reports and tables, and the code of the queries, where you need to load data from the appropriate tables — Analytics_YearHits in the yearly report, Analytics_MonthHits in the monthly report, etc. You can make this process easier by using the ![]() Clone report action from the menu above the report tree. Simply create copies of the daily report and then make the necessary adjustments.
Clone report action from the menu above the report tree. Simply create copies of the daily report and then make the necessary adjustments.
Once there are some hits logged in the database for a statistic, it will automatically be available under the Custom category of the tree in CMS Desk -> Tools -> Web Analytics. There are a couple more steps that should be taken to ensure that the statistic is displayed properly.
12. It is necessary to create the resource string that will be used as the title of the custom statistic. Go to Site Manager -> Development -> UI cultures, click ![]() New string and enter the values below:
New string and enter the values below:
•Key: analytics_codename.buttonclicked; in general, the key of the string must always be in format analytics_codename.<statistic code name>.
•Text: Button clicks; you may enter any required text. If you are using a multilingual UI, you can enter translations of the string for specific cultures via the All cultures tab.
•Custom string: checked
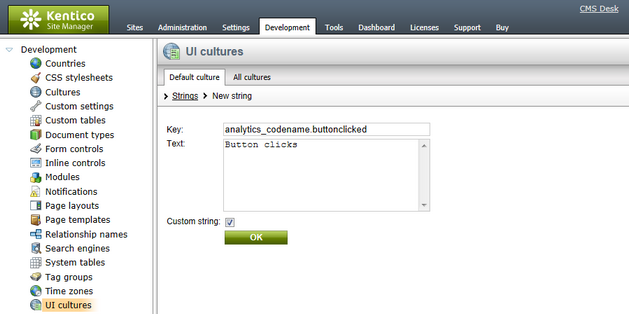
Click OK.
You may also add a custom icon for the new statistic. Such icons have to be stored in ~\App_Themes\Default\Images\CMSModules\CMS_WebAnalytics and their name must be in format <statistic code name>.<extension> (e.g. buttonclicked.png in this scenario). If there are any period characters ('.') in the code name, you can replace them with an underscore ('_') to create a valid file name.
13. Finally, go to CMS Desk -> Tools -> Web Analytics and expand the Custom category in the tree. A new item will be available and its reports will display the statistics of the tracked button click event.