Click edit next to some of the report categories and choose the Reports tab. Click New report and enter the following values:
| • | Report display name: Pages by page template |
| • | Report code name: PagesByPageTemplate |
Click OK. Now you can edit the layout of the report and insert tables, graphs and values.
Editing report layout
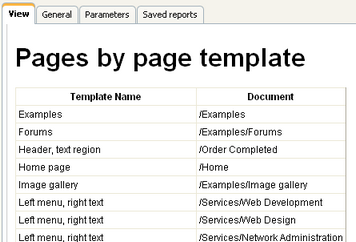
Enter the following text in the layout editor: Pages by page template
Select the text and set its format to Heading 1. Click OK to save changes.
Adding a table
Click Add in the Tables section on the right. Enter the following values:
| • | Display name: Pages by Page Template |
| • | Code name: PagesByPageTemplate |
| • | Query: |
SELECT PageTemplateDisplayName as [Template Name], DocumentNamePath as [Document] FROM view_CMS_Tree_Joined LEFT JOIN cms_pagetemplate ON cms_pagetemplate.pagetemplateid = view_CMS_Tree_Joined.DocumentPageTemplateID WHERE pagetemplatedisplayname IS NOT NULL AND PageTemplateIsReusable = 1 ORDER BY PageTemplateDisplayName |
| • | Is stored procedure: no |
Click OK. Place the cursor in the layout editor under the title, choose the table in the Tables section and click Insert. Click OK to save changes and switch to the View tab. You will see a report like this:
|
Writing queries for tables
The queries you write for the tables are standard SQL queries that pull data from the Kentico CMS database. You can find the description of Kentico CMS database tables and views in Kentico CMS Database Reference that is part of the standard installation.
For information about documents, you can use the View_CMS_Tree_Joined table that returns published versions of all documents.
Table column names
The table column names use the column names from the returned data set. If you need to use user friendly names, you can use the following syntax:
|

Adding a Graph
Switch back to the General tab. Click Add in the Graphs section on the right. Enter the following values:
| • | Display name: Most Favorite Page Templates |
| • | Code name: MostFavoritePageTemplates |
| • | Query: |
SELECT PageTemplateDisplayName AS [Template Name], count(PageTemplateDisplayName) AS [Usage] FROM view_CMS_Tree_Joined LEFT JOIN cms_pagetemplate ON cms_pagetemplate.pagetemplateid = view_CMS_Tree_Joined.DocumentPageTemplateID WHERE pagetemplatedisplayname IS NOT NULL AND PageTemplateIsReusable = 1 GROUP BY PageTemplateDisplayName ORDER BY count(PageTemplateDisplayName) DESC |
| • | Is stored procedure: no |
| • | Graph type: Pie |
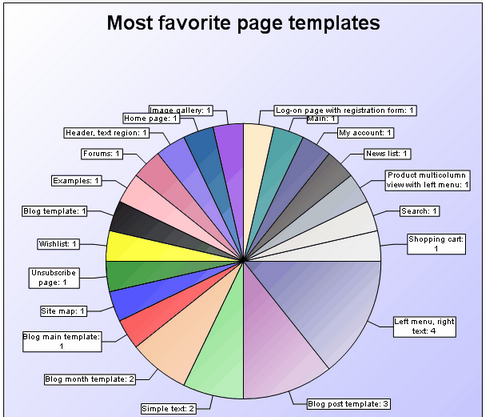
| • | Title: Most favorite page templates |
| • | Width: 600 |
| • | Height: 600 |
| • | Legend position: (No legend) |
Click OK. Place the cursor in the layout editor under the table, select the graph in the Graphs section and click Insert. Click OK to save changes and switch to the View tab. You will see a graph like this in the report:
Here is a complete list of graph properties and their descriptions:
Display name |
Display name of the graph |
Code name |
Code name of the graph |
Query |
Database query that extracts a dataset that will be displayed in the graph; it must return at least two columns - first one for categories, the other columns are used for values. |
Is stored procedure |
Determines if the specified query is a stored procedure. |
Graph type |
the following graph types are available: Pie - pie graph, accepts only one column for values, value in the third column is used for setting 'pie pieces' offset
Bar - bar graph, accepts multiple values and displays them next to each other
Bar overlay - bar graph, accepts multiple values and displays them behind each other with the lower values in the front
Bar stacked - bar graph, accepts multiple values and displays them on top of each other
Bar percentage - bar graph, accepts multiple values, displays one column for each category and divides it by percentage determined by the values
Line - line graph, accepts multiple values and displays them as separate lines |
Use vertical bars
|
If checked, the bars are displayed vertically instead of horizontally; used only for bar graphs |
Reverse y-axis |
Reverses the vertical axis; used only for bar and line graphs |
Use ten powers |
If large values are present in the graph, they are divided by appropriate ten powers and the divide ratio is displayed with the y-axis title |
Show grid |
Shows thin dotted line grid in the graph chart; used only for bar and line graphs |
Fill curves |
Fills the space under the curves with a color; used only for line graphs |
Smooth curves |
Smooths lines of the line graph |
Title |
Title of the graph |
X axis title |
Title of the horizontal axis in the graph |
Y axis title |
Title of the vertical axis in the graph |
Width |
Width of the graph image |
Height |
Height of the graph image |
Legend position |
Position of the legend in the graph |
Title font |
Determines font properties of the graph title |
Axis font |
Determines font properties of axis titles |
X-axis angle |
Determines declination angle of X-axis descriptions; setting this parameter to 90 causes upright descriptions |
Y-axis angle |
Determines declination angle of Y-axis descriptions |
Scale min |
Determines the minimum value from that will values in the graph be displayed |
Scale max |
Determines the maximum value up to that will values in the graph be displayed |
Use colors |
Determines colors used for graph items; accepts standard HTML color names or hexadecimal color codes divided by a semicolon; if lesser number of colors than is entered, remaining colors are generated automatically |
Use symbols |
Determines symbols used for values in the line graphs; accepts: Circle, Diamond, HDash, Plus, Square, Star, Triangle, TriangleDown, VDash, XCross; if None is entered, no symbols will be used |
Graph gradient |
Gradient of the graph background; The From and To fields accept standard HTML color names or hexadecimal color codes, the Angle field sets gradient declination |
Chart gradient |
Gradient of the graph chart; The From and To fields accept standard HTML color names or hexadecimal color codes, the Angle field sets gradient declination; used only for line and bar graphs |
Item gradient |
Gradient of the items in the graph; The From field accepts standard HTML color names or hexadecimal color codes, the Angle field sets gradient declination; the To field is disabled here |
|
Writing queries for pie charts
The queries for pie chart graphs must return two columns: the categories and their values. The graph automatically calculates the displayed size of the given category. If you return a constant value in the third column, this value will set pie pieces offset.
Writing queries for bar charts
The queries for the pie chart must return at least two columns: the categories and their values. If you specify more than two columns, the additional columns will be displayed next to the second column value in the graph (Bar), in front of each other (Bar overlay), on top of each other (Bar stacked) or they will divide one column by percentage (Bar percentage). |

Adding a Scalar Value
Click Add in the Values section on the right. Enter the following values:
| • | Display name: Number of pages with page template |
| • | Code name: PagesWithTemplate |
| • | Query: |
SELECT count(DocumentID) FROM view_CMS_Tree_Joined WHERE documentpagetemplateid IS NOT NULL |
| • | Is stored procedure: no |
| • | Formatting string: Pages with template: {0} |
Click OK. Place the cursor in the layout editor under the graph, choose the value in the Values section and click Insert. Click OK to save changes and switch to the View tab. You will see a text like this:
|
Writing queries for scalar values
The queries for scalar values may return any number of columns and rows, but the only value that will be displayed is the value in the first column of the first row of the result set.
Formatting scalar values
You can format the displayed value using the standard .NET expressions. Examples:
You can find more details in .NET Framework documentation. |

|
Localizing strings in reports
If you need to create a single report in multiple languages, please use the Localization Expressions.
|
