|
|

Monitoring using Performance monitor |

|

|

|

|
|
Monitoring using Performance monitor |
|
|

|
|
|
|
Monitoring using Performance monitor |
|
|
|
|
|
Monitoring using Performance monitor |
|
|
|
|
|
|
||
When you have performance counters for your instance of Kentico CMS registered in Windows and Health monitoring settings adjusted, you can start monitoring values written to the counters. There is a number of applications that can be used for this purpose. In this topic, we will use the built-in Performance monitor that is a native part of Windows 7, Windows Server 2008 R2 and Windows Vista.
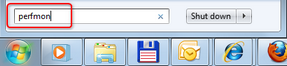
To execute Performance monitor, type perfmon in Windows Start menu search box and press Enter.
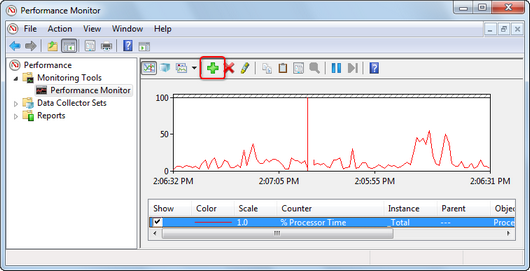
Performance monitor will be launched. In the tree on the left, select Monitoring Tools -> Performance monitor. As you can see, only the default % Processor Time counter is monitored initially. To add the Kentico CMS counters, click the Add (![]() ) icon in the toolbar at the top, as highlighted in the following screenshot.
) icon in the toolbar at the top, as highlighted in the following screenshot.
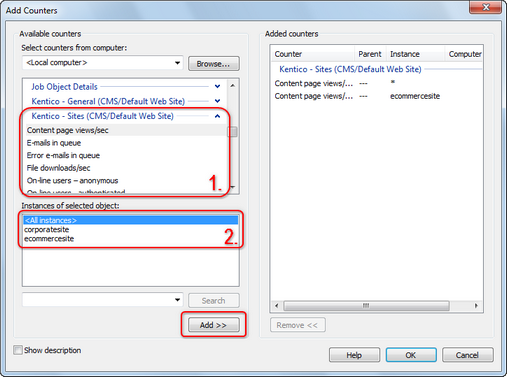
The Add Counters window pops up. From the Select counters from computer drop-down list, choose <Local computer>. In the section below, you will see a list of all counter categories currently registered in Windows. Among them, you will find two counter categories for each Kentico CMS instance with registered performance counters — Kentico - General (<IIS path>/<IIS website>) and Kentico - Sites (<IIS path>/<IIS website>).
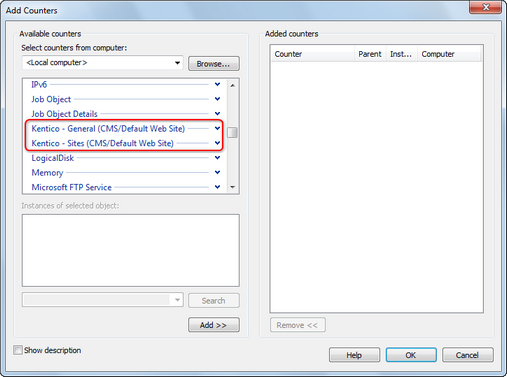
If you click the down-arrow next to a category name, you will expand all counters present in the category (1. in the screenshot below). You can either add all counters in a category by selecting the category and clicking Add >>, or just individual counters by selecting the counter and clicking the Add >> button.
When a counter from the Site category is selected, you can add it either for an individual website, or for all websites running in the instance. To add it for all websites, select the counter, then choose <All instances> in the Instances of selected objects section (2. in the screenshot below) and click Add >>. To add it for an individual website, select the counter, then choose the website's code name in the Instances of selected objects section and click Add >>.
Added counters will be listed in the Added counters section on the right. Once you have all counters added, click OK to return back to the monitoring UI.
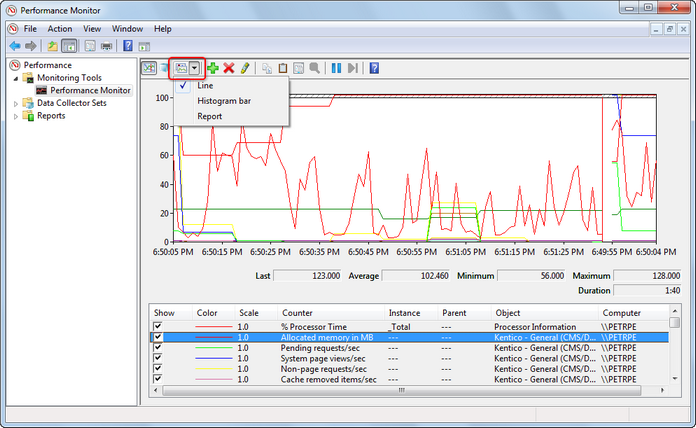
Back in Monitoring Tools -> Performance Monitor, you can see that values in counters are now shown in a graph and reflect the real activity of the Kentico CMS instance. You can switch between different ways how monitored values are displayed using the Graph type drop-down list highlighted in the screenshot below.