|
|

Macros |

|

|

|

|
|
Macros |
|
|

|
|
|
|
Macros |
|
|
|
|
|
Macros |
|
|
|
|
|
|
||
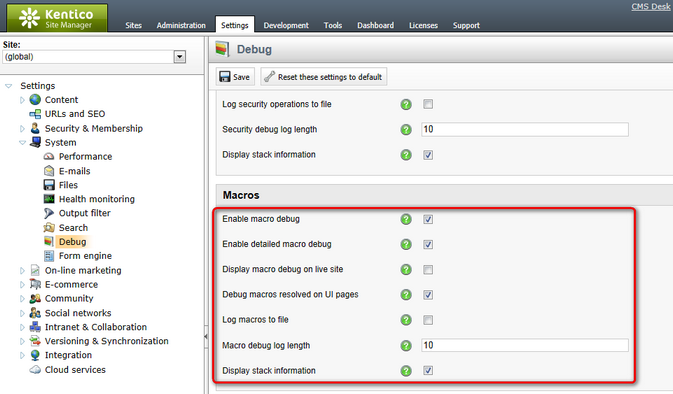
Macro debugging can be turned on and configured either by adjusting certain settings in Site Manager -> Settings -> System -> Debug, or by adding certain keys into the AppSettings section of your web.config file. The following table lists and explains these settings and keys:
Setting |
Web.config key |
Description |
Enable macro debug |
CMSDebugMacros |
Enables macro debugging and the Macros tab in Site Manager -> Administration -> System -> Debug. |
Enable detailed macro debug |
N/A |
If enabled, the macro debug will additionally display the results of all sub‑elements used within macro expressions. This allows you to check the exact data content of a macro's components during each step of the resolving process.
Detailed macro debugging is highly recommended if you encounter problems with complex expressions. If disabled, only the final result of each macro will be shown in the debug.
The detailed debug may also be enabled only for specific expressions by adding the |(debug) parameter to the given macro. |
Display macro debug on live site |
CMSDebugMacrosLive |
If enabled, macro debug information is also displayed at the bottom of each live site page. This option requires macro debugging to be enabled. |
Debug macros resolved on UI pages |
CMSDebugAllMacros |
If enabled, macros resolved on pages of the administration interface (CMS Desk and Site Manager) will also be included in the macro debug. This option requires macro debugging to be enabled. |
Log macros to file |
CMSLogMacros |
If enabled, macro debug log is saved into the logmacros.log file in the ~\App_Data folder. This option does not require macro debugging to be enabled. |
Macro debug log length |
CMSDebugMacrosLogLength |
Sets the maximum length of the macro debug log on the Debug -> Macros tab, i.e. the number of requests for which debug information is preserved and displayed on the tab. If empty, value of the Default log length setting (or the CMSDebugEverythingLogLength key) is used. |
Display stack information |
CMSDebugMacrosStack |
If enabled, stack is tracked when debugging cache macros and is displayed in the Context column. This information is only available in the debugging UI and on the live site, not in the debug log written into the logmacros.log file. |
It may happen that you specify different configuration in the settings and in the web.config file. In such cases, boolean settings (true/false) need to be enabled at least in one place (in web.config or in settings) in order to be enabled, while log lengths specified in Site Manager -> Settings have higher priority than log lengths specified in the web.config.
Here is a list of these keys for easy copy&paste into your web.config:
<add key="CMSDebugMacros" value="true" /> <add key="CMSLogMacros" value="true" /> |
Macro debugging can also be enabled using the general settings and keys.
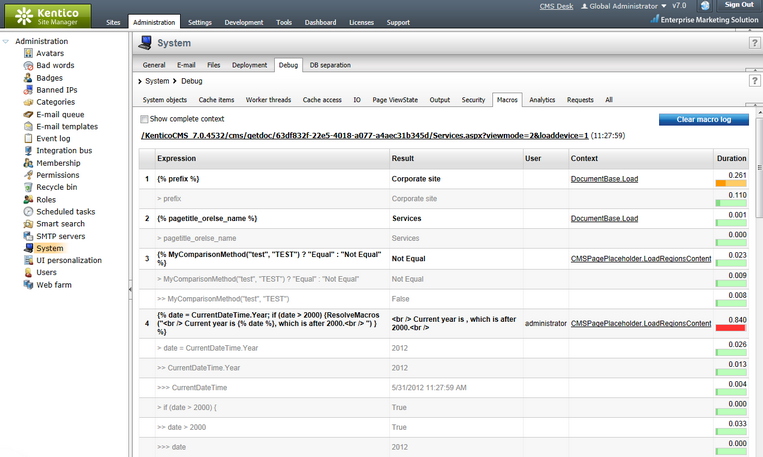
On the Debug -> Macros tab, you can see which macros were recently resolved. For each macro, the log displays the exact expression, the result (the value into which it was resolved) and the context from which it was called. If detailed macro debugging is enabled, the results will also be displayed for individual sub‑elements that make up each macro expression. This is useful if you want to analyze how macros were processed.
Enabling the Show complete context check-box displays the complete context (not only the topmost item) in the Context column. The log can be cleared using the Clear macro log button.