|
|

HTML graphs |

|

|

|

|
|
HTML graphs |
|
|

|
|
|
|
HTML graphs |
|
|
|
|
|
HTML graphs |
|
|
|
|
|
|
||
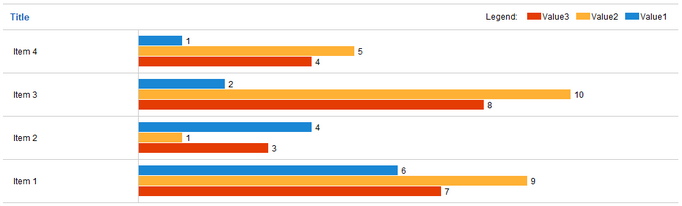
In addition to the image-based graphs described in the previous topic, data can be visually represented in HTML graphs. Graphs of this type are composed purely out of HTML code (table and DIV elements). As a result, they can be dynamically scaled according to the amount of data that needs to be displayed, unlike an image with a predefined size.
HTML graphs always use a horizontal bar layout, which can easily be extended to display any number of items. In most cases where scaling is not an issue, it is recommended to use standard graphs, since they offer more customization options and graphical flexibility.
Like other reporting tools, HTML graphs retrieve the data to be displayed using queries. The queries must return at least two columns: the first column is used for items and the others for their values. If more than two columns are specified, the values of these additional columns will be displayed below each other as differently colored bars.
By default, data is displayed in descending order, i.e. with the newest items at the top of the graph.
When creating or editing a HTML graph, the following properties are available:
Display name |
Display name of the graph shown in the user interface. |
Code name |
Code name of the graph. |
Enable export |
If enabled, users who view the graph will be able to export the displayed data to external files using the Microsoft Excel (XLSX), CSV or XML format. The data export feature may be accessed by right‑clicking the graph in the report, which will open a context menu with possible export actions. |
Query |
Database query that extracts the data that will be displayed in the graph. It must return at least two columns: first one for categories, the other columns are used for values. |
Is stored procedure |
Indicates if the specified query is a stored procedure. |
No record text |
Text to be displayed if the query doesn't return any data. |
Title |
Sets the title of the graph. |
Legend title |
Sets the text caption of the legend. |
Display legend |
Indicates if the legend should be displayed. |
Item name format |
Can be used to specify the format of item descriptions on the X axis that are in numerical or date‑time format.
Numeric formatting:
Numbers can be formatted using .NET Custom numeric format strings.
Examples:
Item # - X axis descriptions will be displayed as Item 1, Item 2 etc. {0.00} - numeric X axis descriptions will be displayed with precision of two decimal places.
Date and time formatting:
The format can be set using single‑letter Standard date and time format specifiers without quotes.
In addition, any custom formatting can be defined. For example, yyyy - MM - dd - hh:mm would specify a date and time format like: 2010 - 08 - 19 - 12:30 |
Item value format |
Sets the format of the text displaying the values of series items on the Y axis of the graph.
This field supports all types of Kentico CMS macro expressions. The following context macros should be used most frequently:
•{%ser%} - resolves into the name of the current item's series, i.e. the type of the value. •{%xval%} - resolves into the X axis value of the current item. •{%yval%} - resolves into the Y axis value of the current item. •{%pval%} - resolves into the percentage that the value of the current item represents out of the sum of all values in the graph. If there are multiple types of Y axis values, they are all included in the total sum.
The format of the values can additionally be specified using the macro parameters listed in the topic linked above.
Examples:
•{%ser%} = {%yval%} - displays the name of the series and its value (e.g. Visits = 287). •{%pval|(todouble)0.0|(format){0:0.0}%}% - displays the item's percentage value rounded to one decimal place (e.g. 5.1%).
|
Item tooltip |
Determines the content and format of the tooltip that is displayed when hovering over a series item in the graph. The macro expressions described in the Item value format property can also be used in this field. |
Item link |
Causes the series items in the graph to serve as links to the specified URL when clicked. The macro expressions described in the Item value format property can also be used in this field. |
HTML graphs are entered into the report layout editor as an expression in the following format:
%%control:ReportHtmlGraph?<report code name>.<graph code name>%%
This is done automatically when the Insert button is used.
|
HTML graphs on the live site
Because of the way they are constructed, HTML graphs are only displayed correctly in the administration interface. The necessary styles will not be applied on the live site.
Therefore, it is recommended to avoid publishing reports containing HTML graphs on your website (more information about this process can be found in the Displaying a report on the website topic). |
