|
|

Analyzing A/B test results |

|

|

|

|
|
Analyzing A/B test results |
|
|

|
|
|
|
Analyzing A/B test results |
|
|
|
|
|
Analyzing A/B test results |
|
|
|
|
|
|
||
The data gathered during the course of A/B testing may be viewed in reports that display various types of conversion metrics. To access the main interface containing these reports, go to CMS Desk -> On-line marketing -> Web analytics and expand the Optimization -> A/B tests category.
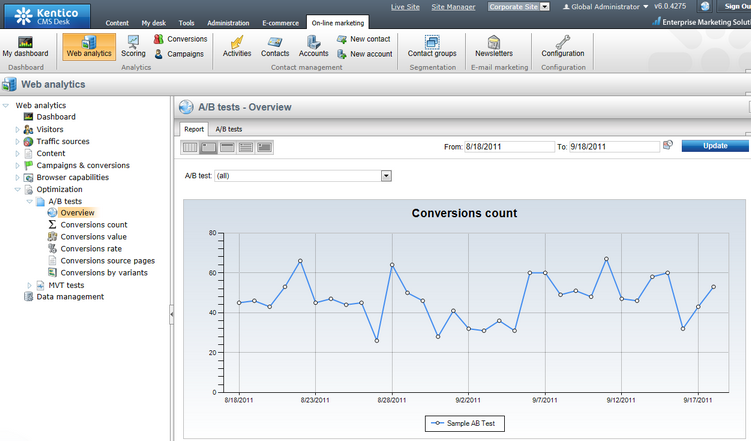
When viewing a report, the From and To fields on the right can be used to enter a time period. Only conversion hits that were logged for the selected A/B test during the specified interval will be included in the data.
The following options allow you to choose which unit of time should be used in the report:
•![]() Hour
Hour
•![]() Day
Day
•![]() Week
Week
•![]() Month
Month
•![]() Year
Year
This selection determines the length of time which is represented by individual units in the report's graphs and the precision that can be specified in the From and To fields.
The Conversions drop‑down list may be used to select which conversion's statistics should be displayed. Please note that the system logs all conversion hits generated by visitors who have passed through a page where an A/B test is running. If there are many conversions defined on your website, only those that can somehow be affected by the differences in the A/B test's page variants will contain relevant data.
Data in the reports is represented by two possible types of graphs. The line charts show the progress of a certain conversion statistic over time and display combined data for all of the A/B test's variants. The bar graphs contain details for individual units of time according to the selected report type (hours, days, months etc.). You may also view the conversion data in a table located between the graphs. Each row in the table shows the data logged for a specific page variant, both for the time period currently displayed by the report and the entire duration of the test.
The following reports are available for A/B testing:
Overview |
This report can be used to view the progress of the primary metrics measured for the site's A/B tests from a single location. |
Conversions count |
Displays the number of conversion hits logged for the selected A/B test during the specified time interval.
In the bar graph, the number of conversion hits is divided into categories that represent individual page variants. This allows you to compare the A/B test's variants and determine which one generated the most conversions (in absolute terms). |
Conversions value |
Displays the sum of the conversion values logged for the selected A/B test during the specified time interval.
In the bar graph, the conversion values are divided into categories that represent individual page variants, which allows you to determine which variant generated the highest total conversion value. This way you can easily evaluate an A/B test's variants when using weighted conversions that have a different level of importance. |
Conversions rate |
Used to indicate how many visitors who access the tested page perform a conversion. The conversion rate is calculated as the amount of logged conversion hits divided by the total number of visitors on the variants of the tested page.
If you select the (all) option from the Conversions drop‑down list, then the rate will be measured for all possible conversions, i.e. as the percentage of visitors who generated at least one conversion hit of any type.
The conversion rate in the bar graph is displayed for individual page variants. This allows you to compare the A/B test's variants and determine which one encouraged the highest share of its visitors to perform a conversion. |
Conversions source pages |
Displays hit statistics for individual conversions that were logged as part of the selected A/B test during the specified time interval.
The data logged for the chosen conversion is categorized according to the page variants defined for the given A/B test. This allows you to easily determine which variant generated the most conversion hits of the selected type. |
Conversions by variants |
Displays details of the number of hits logged for each conversion by individual page variants defined for the selected A/B test. You can select the variant that you wish to evaluate from the Variants drop‑down list.
The hits logged for the chosen variant are divided into categories that match individual conversions. This allows you to easily measure which conversions are performed most commonly by visitors assigned to the selected page variant. |
|
Reports for individual A/B tests
These reports can also be viewed when editing the original page of an A/B test in CMS Desk -> Content -> Edit -> Analytics -> A/B testing -> Reports.
The same options are available as described for the web analytics interface, but statistics are only displayed for the currently edited A/B test. |
The following actions may also be performed for the reports:
•![]() Save - saves the report in its current state (according to the selected time interval). To view saved reports at a later time, go to CMS Desk -> Tools -> Reporting, select the matching report under the A/B testing category and switch to the Saved reports tab. This action is only available for users who have the Save reports permission for the Web analytics module.
Save - saves the report in its current state (according to the selected time interval). To view saved reports at a later time, go to CMS Desk -> Tools -> Reporting, select the matching report under the A/B testing category and switch to the Saved reports tab. This action is only available for users who have the Save reports permission for the Web analytics module.
•![]() Print - allows the report to be printed. The available options depend on the used browser.
Print - allows the report to be printed. The available options depend on the used browser.
•![]() Delete data - can be used to clear all conversion hits logged during the specified time period for the selected A/B test. Please note that this permanently removes the data from the database. This action is only available for users who have the Manage data permission for the Web analytics module.
Delete data - can be used to clear all conversion hits logged during the specified time period for the selected A/B test. Please note that this permanently removes the data from the database. This action is only available for users who have the Manage data permission for the Web analytics module.
The data displayed in the reports can be exported into external files using various formats. This can be done by right‑clicking on a specific graph, which will open a context menu offering the following options:
•![]() Export to Excel - exports the data displayed by the given object to an XLSX spreadsheet.
Export to Excel - exports the data displayed by the given object to an XLSX spreadsheet.
•![]() Export to CSV - exports data to a CSV file.
Export to CSV - exports data to a CSV file.
•![]() Export to XML - exports data to an XML file.
Export to XML - exports data to an XML file.
After you select an action from the menu, your browser's standard file download dialog will pop up, letting you open or save the file with the exported data just like when downloading any other type of file. For more details on the data export feature, please refer to the Modules -> UI data export chapter.
