|
Creating custom reports |

|

|

|

|
|
Creating custom reports |
|
|
|
|
This example describes in detail how to log custom events and how to display result statistics. A button click event will be logged for this purpose.
Logging the event
To log custom events for web analytics, use the following code from CMS.Analytics namespace:
HitLogProvider.LogHit(string codeName, string siteName, string culture, string objectName, int objectId[, int count]);
| • | codeName - statistics code name, it is also used in report’s code names |
| • | siteName - site name |
| • | culture - culture code |
| • | objectName / objectId - it is possible to specify the log either by name or by ID |
| • | count - it is weight of the log, default value is 1 |
An example of logging a button click event follows:
[C#]
using CMS.WebAnalytics; using CMS.CMSHelper;
protected void Button1_Click(object sender, EventArgs e) { if (AnalyticsHelper.AnalyticsEnabled(CMSContext.CurrentSiteName)) { HitLogProvider.LogHit("buttonclicked", CMSContext.CurrentSiteName, null, CMSContext.CurrentUser.UserName, 0); } } |
The statistics code name is buttonclicked and the logged value is user name of the current user who clicked the button. Now logs will be created and stored in the database after clicking the button. Before you can see your statistics in CMSDesk -> Tools -> Web Analytics, the reports have to be done in CMSDesk -> Tools -> Reporting. The next step is creation of reports which display statistics in a graph or table form.
Creating reports
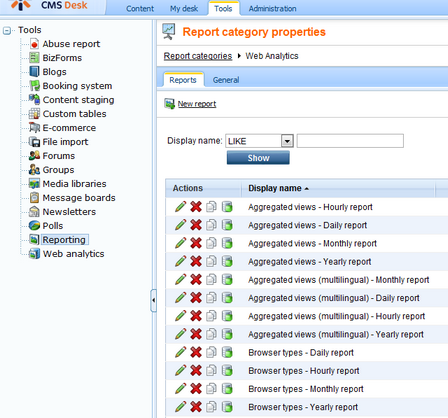
Go to CMSDesk -> Tools -> Reporting and choose to Edit (![]() ) the Web Analytics category. There are some reports already in the list. These reports belong to default statistics like page views, visits, campaigns, etc. Each statistics has four reports: daily, weekly, monthly and yearly report.
) the Web Analytics category. There are some reports already in the list. These reports belong to default statistics like page views, visits, campaigns, etc. Each statistics has four reports: daily, weekly, monthly and yearly report.
Code names of the reports have to be in a specific form:
| • | <statisticscodename>.yearreport |
| • | <statisticscodename>.monthreport |
| • | <statisticscodename>.dayreport |
| • | <statisticscodename>.hourreport |
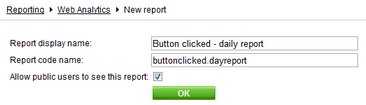
In our example <statisticscodename> is buttonclicked, as defined above.
Now you will create a daily report for the new statistics. Click the ![]() New report link and enter the values as displayed in the screenshot below. Please do not forget to check the Allow public users to this report checkbox.
New report link and enter the values as displayed in the screenshot below. Please do not forget to check the Allow public users to this report checkbox.
Go to the Parameters tab and by clicking the New attribute (![]() ) icon create three essential parameters which will be used in queries:
) icon create three essential parameters which will be used in queries:
| • | FromDate - Date and Time attribute type |
| • | ToDate - Date and Time attribute type |
| • | CodeName - Text attribute type; statistics code name as attribute default value |
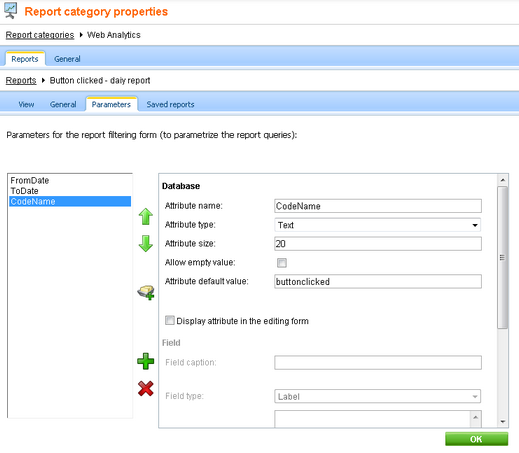
Disable the Display attribute in the editing form for all parameters.
Go to the General tab and click the Add button in the Tables section to create a report table:
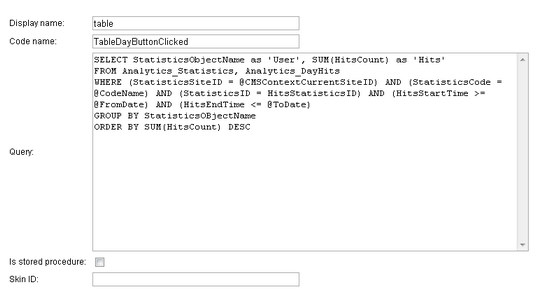
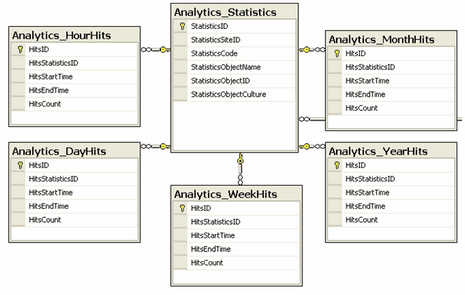
Please note that there are six important database tables used in the web analytics module.
The Analytics_Statistics table contains general information about statistics, other five tables store statistics hit records for a specific time period – Analytics_HourHits, Analytics_DayHits, Analytics_WeekHits, Analytics_MonthHits and Analytics_YearHits. As the report is a daily report, the Analytics_DayHits table is used together with the Analytics_Statistics table. See the diagram below to understand the database structure of web analytics:
Now click OK and use the Insert button in the Tables section to insert a macro into the layout of the report. Click OK again - the daily report is now ready.
| 1. | Other reports are similar, the only difference is in queries where you should use the appropriate tables like Analytics_YearHits in the yearly report, Analytics_MonthHits in the monthly report, etc. |
| 2. | The last thing you should do is insert a string into resources, which will be used in the statistics list in CMSDesk -> Tools -> Web Analytics. The form of the resource key has to be as follows – analytics_codename.<codename>; it is analytics_codename.buttonclicked for the purpose of this example. You may also add a specific icon for new statistics. Icons are stored in ~\App_Themes\<used theme>\Images\CMSModules\WebAnalytics\Icons\. The name should be in form <codename>.gif. If there are any ‘.’ in codename, replace them with ‘_’. |
And finally the result:
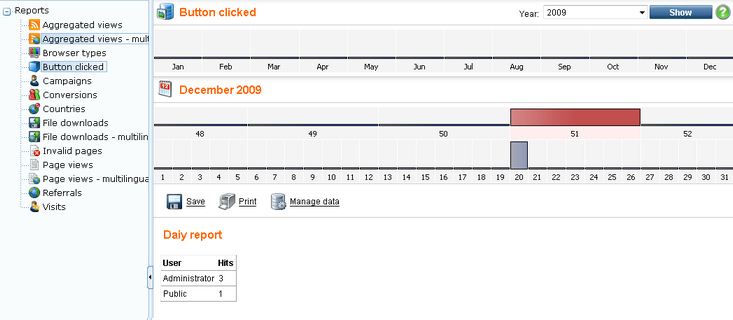
Page url: http://devnet.kentico.com/docs/5_5r2/devguide/index.html?creating_custom_reports.htm

