Debugging options in Kentico CMS 5.0
Version 5.0 comes with many improvements in debugging options. You cannot find the details about them in the documentation, so I thought I would give you some brief overview what is available for you ...
Hi there,
Debugging is an important part of the site development process where you typically find and fix any potential performance or settings issues on your web site.
Introduction
Kentico CMS debugging is not something that you can find on our product roadmap or as the official feature. The reason for it that it that the debug is pretty much developed by myself based on the current implementation or consulting needs. It is sort of my personal achievement rather than the company goal. Basically, if we need to make the development or reviews more comfortable, I go ahead and bind another debug option to be able to more effectively work on something else. That is why the history of debugs looks like this:
-
v3.1 - Basic query debug to identify the potential performance issues - Based on the results from this one we started to improve the overall performance of the entire system
-
v4.0 - ViewState debug to optimize the page sizes and viewstate
-
v4.1- Cache debug to see and optimize the cache usage
-
v5.0 - Advanced cache debug used for the large caching review during 5.0
-
v5.0 - Output debug to solve potential AJAX communication issues
-
v5.0 - Security debug to properly test the security checks related to new UI personalization
-
v5.0 - Request debug to validate the page processing efficiency and better debug the exact behavior of the page
-
v5.0 - Thread debug to identify possible detached threads in the background while load testing
One way or another, the important thing is that these debugs are not only meant for our internal reasons, but also for you. The only issue is that they are not properly documented, since there was no time left for them. That is why I am writing this post here, so you know about them and can use them.
Why you need to know this?
If you master the debug, you can not only save a lot of time on solving your issues, but you can also provide us with detailed information if you struggle with something. If you have any trouble with your web site and can find some related information to it in debug, send it to our support. It will help a lot.
Or, if you are professional enough, you can see the issue and fix it right away, which makes the response time to solve the issue 0.
We know, we have the debugs ;-)
I would also like to say that we are aware that some parts of our code are not perfect, we are working on it, so you don't need to tell us which parts are slow, using too much ViewState etc. We know that, we just didn't have the time to optimize them yet, it is a long time process to fix everything. So unless that parts have significant effect on your projects, you don't need to tell us.
Giving you the debug options is not meant to you analyze our code, but you analyze
your code ;-) But I can say we are not afraid to show you what our app does with your resources, you have the right to know, they are yours.
Let's see what particular debugs can do ...
Debug settings and where you can find them
The debug UI is available from two locations:
-
Site manager -> System -> Debug is the overall debug interface where you can see data from all the enabled debugs for the history of requests (even non-pages)
-
Directly on live site where you can see the debug information for that specific page if you enable the live site debug
The settings are always in web.config, and the sets for all debugs are similar, they just differ in names:
-
CMSDebug<what> - Enables debugging for the specific debug
-
CMSDebug<what>Live - Enables debugging on live site (debug log displayed directly on pages)
-
CMSDebugAll<what> - Enables debugging for all operations, including UI
-
CMSDebug<what>LogLength - Maximal length of the debug log (how many requests should be preserved)
-
CMSLog<what> - Enables logging operations to the file located in ~/App_Data/, useful for analysis of longer time logs for issues that are not so easily reproducible
<what> is the name of what you debug, either in plural or singular, depending on particular form so it seems friendly.
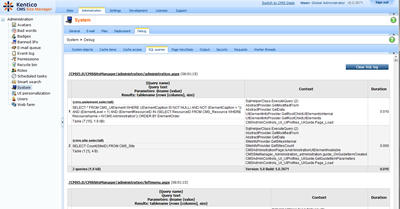
Query debug
With the oldest debug, which is query debug, you can basically see what the specific page request called to the database. You could say that you can do the same with SQL profiler, but it won't give you the ability to filter out set of queries for one specific request, they are always kind of mixed up. Availanble query debug settings are following:
<add key="CMSDebugSQLQueries" value="true" />
<add key="CMSDebugSQLQueriesLive" value="true" />
<add key="CMSDebugAllSQLQueries" value="true" />
<add key="CMSDebugSQLQueriesLogLength" value="10" />
<add key="CMSLogSQLQueries" value="true" /> - Saves to the file ~/App_Data/logsql.log
If you enable the debug and display some page (based on settings either live or UI), you can find its consumed queries on the
SQL queries tab of Debug UI or directly at the end of the the live page.
TIP: If you find some query taking significantly too much time, the problem is most likely either amount of data returned from database (more than you need) or your indexes or statistics are not properly defined. In the second case, I recommend to run the SQL Database Engine Tuning Advisor and make the recommended changes. It cannot be covered by default installation since every project has different needs. If you want your query calls to be included, use our
DataEngine and
GeneralConnection to access the data.
We are optimizing the UI needs so it does need to consume too much SQL resources during development of each version.
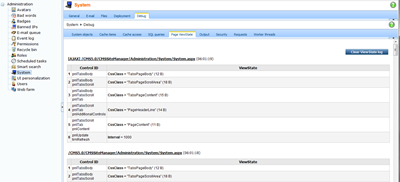
ViewState debug
ViewState is using reflection to access the controls viewstate so it may not work in case you are running under medium trust or with some other limitations, but that is not the typical case on developer machine. Here are the ViewState debug settings, you can see that you don't have the option to log it to the file since ViewState is very easily reproducible.
<add key="CMSDebugViewState"value="true"/>
<add key="CMSDebugViewStateLive"value="true"/>
<add key="CMSDebugAllViewStates"value="true"/>
<add key="CMSDebugViewStateLogLength"value="10" />
You can find the debug information on the
Page ViewState tab or directly on live page.
TIP: You should disable ViewState in all web parts and controls that do not need it (typically labels, literals, etc.), it will reduce the size of your pages. The
ViewState is logged when the page inherits the correct class, it is automatic for Portal engine, served by
TemplatePage class for ASPX, or some basic
CMS page for UI (they all include that).
We are also working on the UI and controls viewstate continuously so each version has smaller ViewState than the previous one.
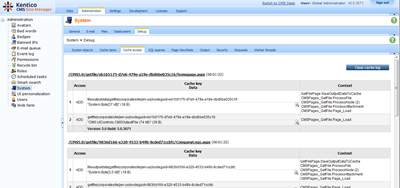
Cache debug
Cache debug is very useful if your application is consuming too much memory, which is typically caused by overcaching the data. You can enable the cache debug with these settings:
<add key="CMSDebugCache" value="true"/>
<add key="CMSDebugCacheLive" value="true"/>
<add key="CMSDebugAllCaches" value="true"/>
<add key="CMSDebugCacheLogLength" value="10"/>
<add key="CMSLogCache" value="true" /> - Saves to the file ~/App_Data/logcache.log
The cache usage information is then available on
Cache access tab or the live page. From 5.0 you can actually see the content of the cache items from admin UI.
TIP: If you find out that some items in the cache contain duplicate data, try to make them use the same cache key (through the cache item name property of the web parts). Your cache operations will be logged if you use our
CacheHelper class to access the cache.
The last major review of caching in Kentico
CMS was done in 5.0 and I can tell you that it saves the process a lot of memory. Of course we continue with the process of optimization also here.
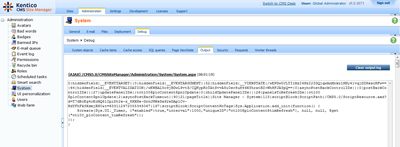
Output debug
Output debug is not so much useful for standard pages, because you can view their code directly in the browser, but when it comes to AJAX, it is a great helper. By actually seeing the entire content of the AJAX response, you can very quickly check what was wrong or if the response isn't too large and make it work better. The settings are:
<add key="CMSDebugOutput" value="true"/>
<add key="CMSDebugAllOutputs" value="true"/>
<add key="CMSDebugOutputLogLength" value="10"/>
<add key="CMSLogOutputToFile" value="true"/> - Saves to file ~/App_Data/logoutput.log
Output debug is available only from the admin UI, tab
Output, it does not make sense on the live page.
TIP: Try to limit the data returned through both standard and AJAX requests to make your web site faster. The output is logged automatically based on settings.
The last change we did with this was making the image selection dialogs faster. We continue in reviewing and optimizing also other UI.
Security debug
Security debug is very useful if you want to learn quickly why the particular user cannot access particular item in the UI or gets redirected to Access denied. You can see the tree of security checks and their final results and based on that you get the information why particular user had(n't) access to particular part of the UI. Keys are following:
<add key="CMSDebugSecurity" value="true"/>
<add key="CMSDebugSecurityLive" value="true"/>
<add key="CMSDebugAllSecurity" value="true"/>
<add key="CMSDebugSecurityLogLength" value="10"/>
<add key="CMSLogSecurity" value="true"/> - Saves to file ~/App_Data/logsecurity.log
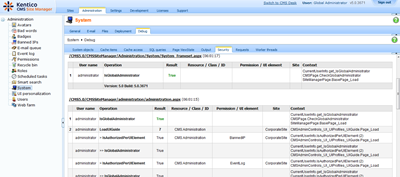
TIP: Use security debug together with the impersonation to see why particular users do not have access to something. The security debug is logged when you use our API to check the security.
We used this mainly for testing the proper behavior of the UI personalization in 5.0, which also provided us the security screening for the UI.
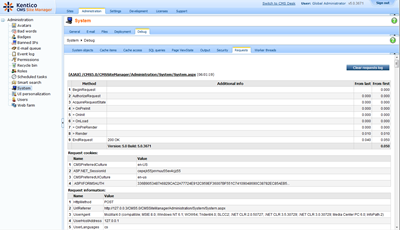
Request debug
Request debug is very useful if your response time gets very large and you need to figure out why. You basically see whether the issue is outside or application or inside by comparing the real response time and response time spent in the application, what data came with the request and from which context. The settings are these:
<add key="CMSDebugRequests" value="true"/>
<add key="CMSDebugRequestsLive" value="true"/>
<add key="CMSDebugAllRequests" value="true"/>
<add key="CMSDebugRequestsLogLength" value="10"/>
You can see the request trace either on live page (until Render) or in admin UI on tab
Requests.
TIP: If the total time spent in request from request debug is significantly smaller than the real response time, you are probably witness of thread contention. It means your app is not configured to enough threads to handle all the incoming requests. To fix this, you need to set up large number working threads corresponding to you installation, see
http://msdn.microsoft.com/en-us/library/ms998549.aspx (Formula for reducing contention) for details. You may encounter the similar behavior if your pool is set to Integrated rather than Classic (should be) on IIS7. Requests are logged automatically, just some parts of the page processing are provided by inherited classes (same as for ViewState).
To be honest we didn't really used it yet but I made this to provide better arguments during our consulations. Sometimes it is just hard to convince some clients that the issue is on their side in their settings, so now it will be easier. Of cource, you can convince yourselves too for free ;-)
Thread debug
The last debug is useful in case that your web is consuming more resources than you think it should. There may be some threads running in the background you didn't realize are there, such as reindexing the Smart search indexes, Sending e-mails etc. With this setting (just one), you can validate that:
<add key="CMSDebugThreads" value="true"/>
You can see the running threads on the tab
Threads. You may also fire a testing one just so you see how it works, it just sleeps for 5 seconds. If you want to have control over your threads, you should use the class
CMSThread for all your new threads, it will give you better functionality also in the future.
TIP: If your web site is not serving many requests but still consuming resources, there may be a worker thread running in the background.
We are now using this mainly during load tests on larger scalability test databases, just to validate that nothing is influencing the RPS we get while measuring throughput.
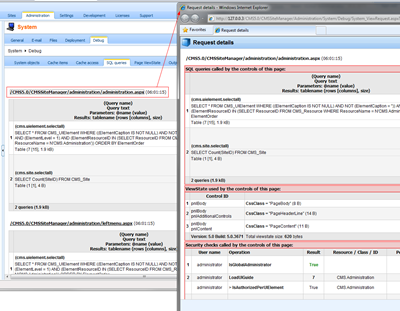
Centralizing request debug
A great new feature in 5.0 is that with any request that produced any data to debug, you can see all other enabled debugs on a single page for that request. Just click on the request URL in the UI, and you will get a new window with the data just that request.
 Overhead of the debug
Of course nothing like this is without costs, when you enable the debug, it consumes resources, both memory and CPU. It basically needs to preserve the data you potentially need to see and all connected debugs from the same request. We never measured how much it costs, but here are my estimations as always:
-
Debug overhead - 1% (If any debug is enabled)
-
Query - 2% (Need to go through the resulting data to get the size)
-
ViewState - 5% (Needs to loop through all controls of the page and their states)
-
Cache - 2% (Same as queries)
-
Output - less than 1% (just preserves the output = takes memory)
-
Security - 2% (Needs to collect the security data while maintaining hierarchy)
-
Requests - 2% (Needs to collect the request data and log the time stamps)
-
Thread - less than 1% (just maintains the list of running thread objects)
So as you can see, it is nothing deadly to your web site, but still, it can consume some resources. So leaving all on is probably not the best idea. Just use it when you really need to
debug something.
With logging to file, it also takes some disk resources and it can produce large files under large loads, so be careful with enabling this on production under load (if you plan this for some reason).
If all debugs are disabled, the system works as usually, without any additional overhead.
Live debug on ASPX pages
If you want to see the debug live on your ASPX pages, just add the control ~/CMSAdminControls/Debug/Debug.ascx to your master template. It will pick up everything needed automatically.
One last thing
If you were patient enough to read until here, here is your treat. With so many debugs you don't want to enable all of them by putting about 30 keys to your web.config if you don't know what are you looking for or if you just want to try them. So here are the "master" keys to all debugs:
<add key="CMSDebugEverything" value="true"/>
<add key="CMSDebugAllForEverything" value="true"/>
<add key="CMSDebugEverythingLive" value="true"/>
<add key="CMSDebugEverythingLogLength" value="20"/>
<add key="CMSLogEverythingToFile" value="true"/> - Every possible operations (including Event log and Email sending log) are logged to the files.
They rule them all but still, the settings for specific debugs have higher priority so you may enable all and disable just some of them.
Plans for the future
As I told you, the debug development is rather generic, based on my spare time and particular needs. So there is no exact plan for that. But I can tell you what is on my mind to tease you a little bit for next versions (not exactly sure if and when). I would like to have:
-
SQL connection debug - To see which connections the request opened and to which servers
-
Online numbers for current RPS for specific URLs at current time
-
Web farm debug - See what web farms had to do to synchronize
I also have some that I am not sure will be easy to do, but let's make it a surprise for you when and if it's done.
See you next time ...